I think most Analytics users tend to create sequences and logic by starting in an empty segment builder. Like a primal instinct.
For me it’s like a reflex I just can’t seem to shake. Something interesting appears in the data. A hunch. A vague theory. A weird smell. Someone started a BBQ at the office? Anyways, before I’ve even finished the thought, I’ve already opened the Segment Builder and started typing conditions into it like a person who definitely knows what they’re doing.
I do not always know what I’m doing.
The Segment Builder and I have a complicated relationship. That’s what it says on Facebook.. or meta. Whatever.
It’s very powerful. It’s also the place where I’ve spent genuine portions of my life carefully constructing logic that turned out to be wrong, slightly off, or something CJA had already built for me somewhere else entirely.
So yeah, CJA and AA has made a lot of that unnecessary. Actually It’s been there for a while. Have I used it? Not really. Have I told others to do it? Yes. Am I starting to use it for real now? Most certainly.
So what I am rambling about is just this:
Several visualizations let you create segments directly from the output. You don’t have to manually create the segment logic. The visualization does the configuration. You just have to save the result and do your analysis work from there. 😮💨🤌
Here are the ones I find most useful (so far).
Histogram: Bucket segments on demand
This is a classic.
And I still think the Histogram is one of the more underused panels in Workspace. It’s great for many different purposes. It has a built-in segmentation behavior that I think is genuinely good.
You locate it under the visualisation tabs in your workspace project.
When you drop a metric into the Histogram, CJA automatically buckets users (or sessions or events) by how many times they triggered that metric. You control the number of buckets and the bucket size.
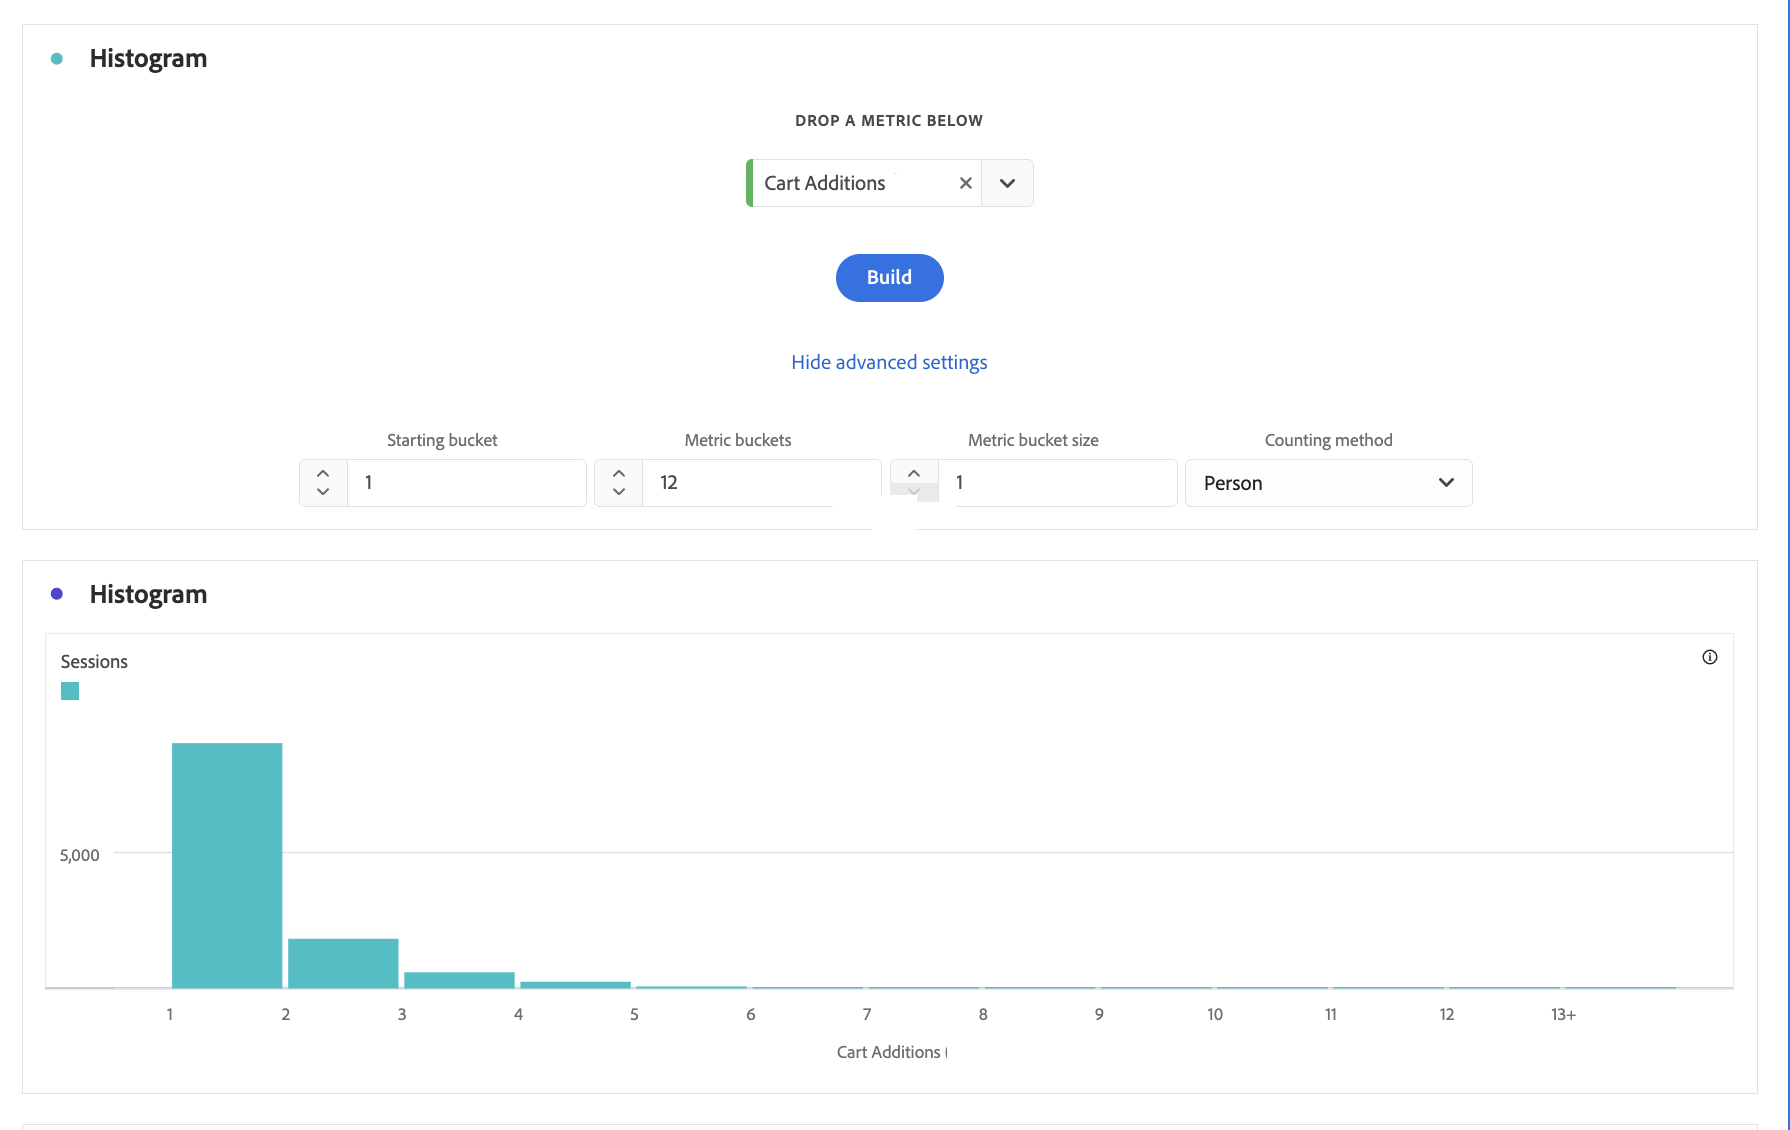
The result is a frequency distribution: how many sessions had 1 cart addition, 2, 3, and so on. If you change the bucket size to 3, you’ll get sessions that had 1-3 cart additions, 3-6, 6-9 and so on.
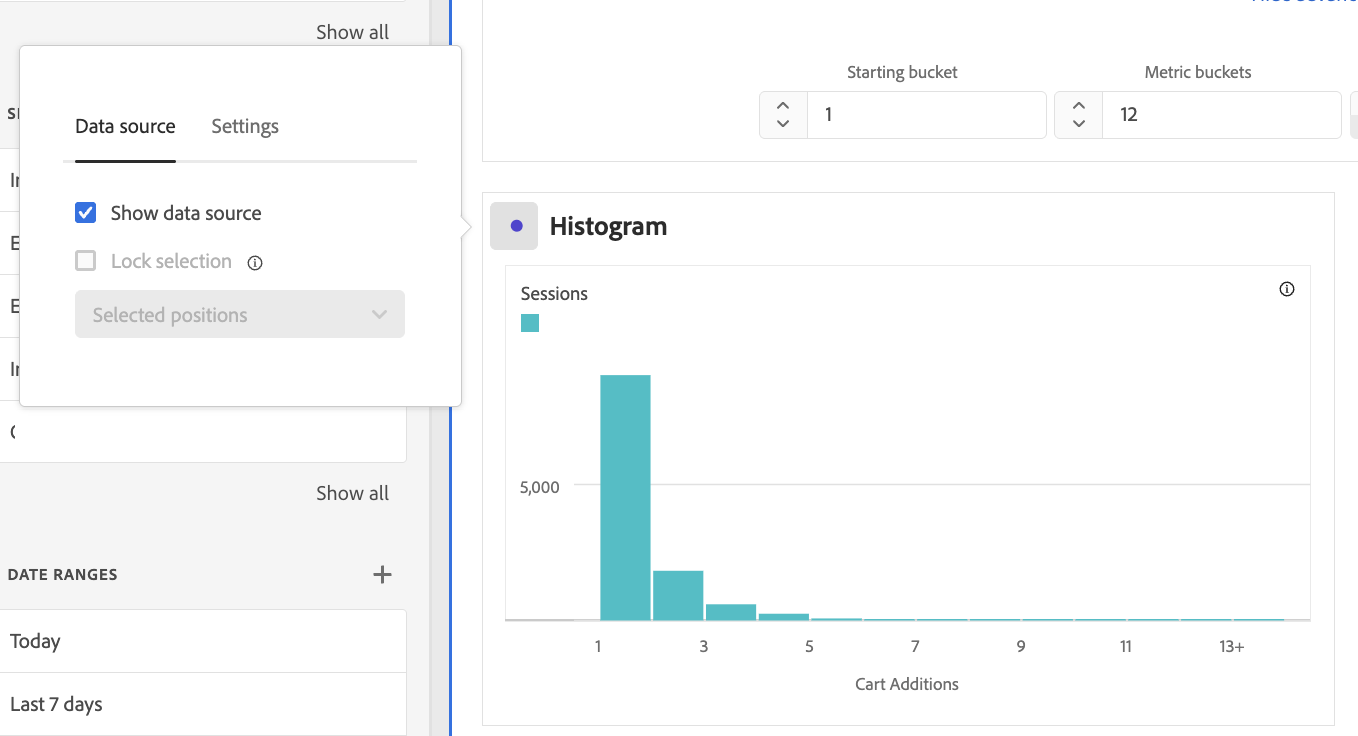
What makes this useful for segmentation is what happens behind the scenes. Each bar in the histogram is actually an auto-generated segment. CJA creates them automatically when it builds the chart.
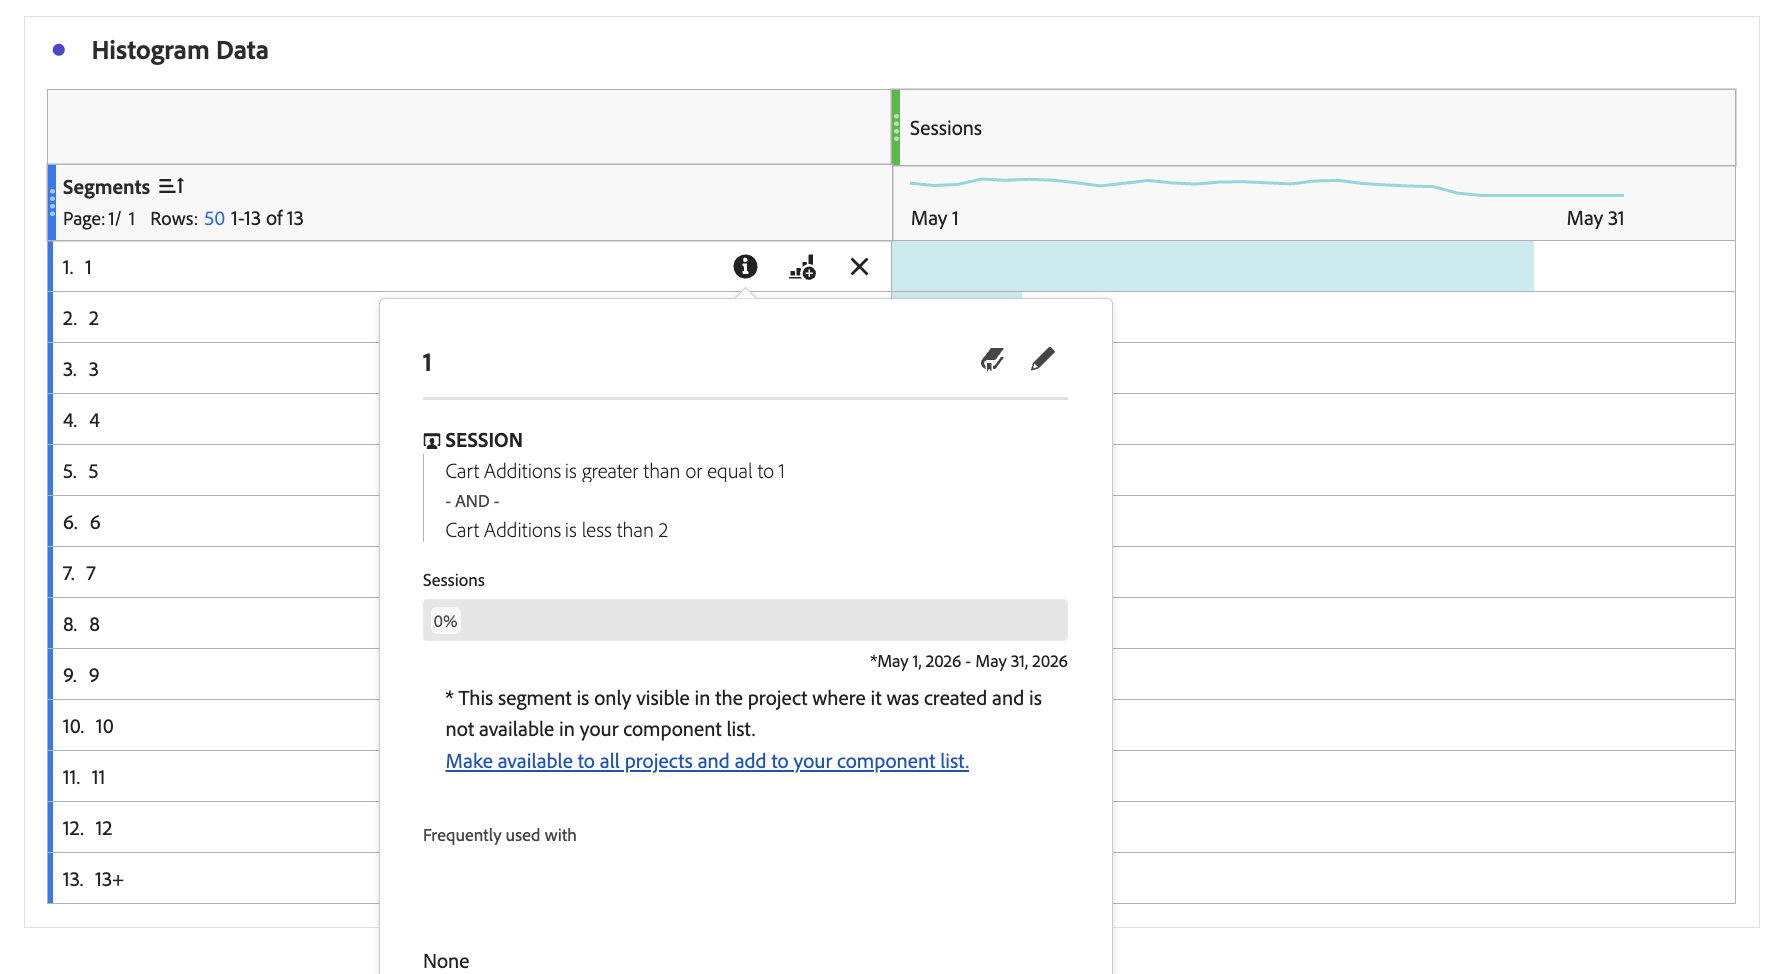
After you click on ‘show data source’ on the histogram, you will see the whole table and all the segments. Click on one of them to see the definition. Eg. the first one here “1”: Cart Additions is greater than or equal to 1 AND Cart Additions is less than 2. CJA wrote that. You didn’t have to.
From there, you can hover over any segment, open the preview, and save it directly to your component list. If you already know you want to separate light users from heavy users by how often they completed an action, the Histogram gets you there. You dont have to start from scratch in the segment builder.
Guided Analysis: Frequency
Now this is a tip I remember from one of the Summit sessions. Here’s the link: Insights Beyond the Stars: Galactic Customer Journey Analytics Tips & Tricks
Guided Analysis has a Frequency view that shows the same kind of distribution from a slightly different angle.
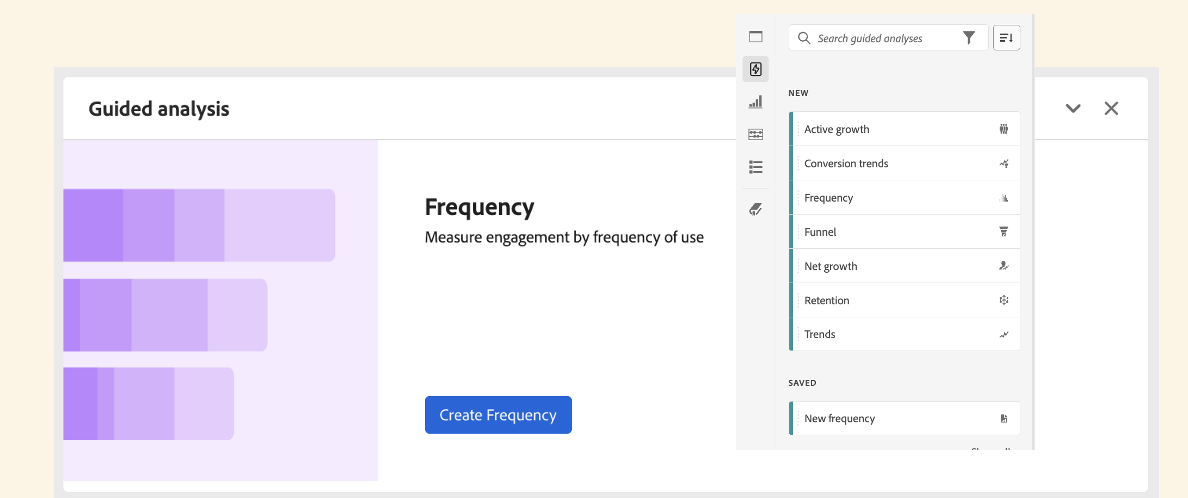
Instead of a free-form chart, you get a clean breakdown of how many users performed an event a given number of times within the date range.
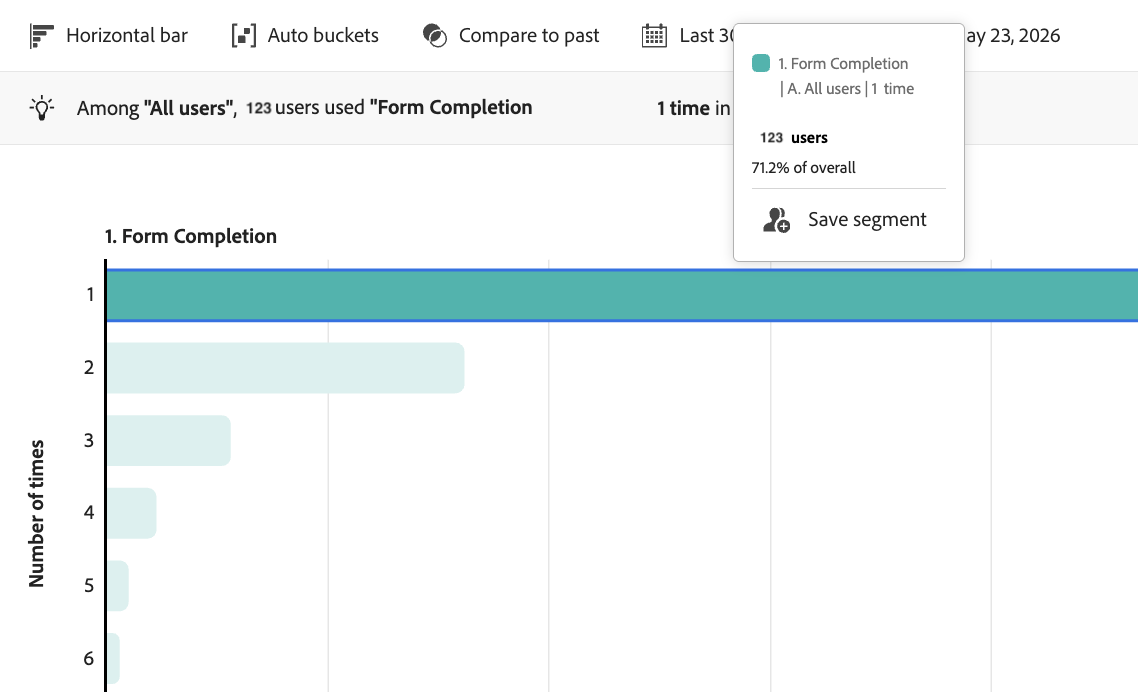
In the example above, 71.2% of users completed the form exactly once. A smaller group completed it two or three times. That’s already a meaningful segmentation story with heavy converters vs. single-event users and you can see it in seconds.
The frequency bars are individually interactive. Hover over one and you get the segment definition plus a direct save option. The segment is built for you based on what you’re looking at.
This is particularly useful when you’re exploring usage intensity. How many times did users trigger a key event before churning? Before converting? Which frequency bucket behaves differently from the others? The Guided Analysis view surfaces the answer visually, and the segment comes with it.
Journey Canvas: Segment from a node
Journey Canvas is primarily a path analysis tool, but it has a segmentation shortcut that I’ve started to use a lot.
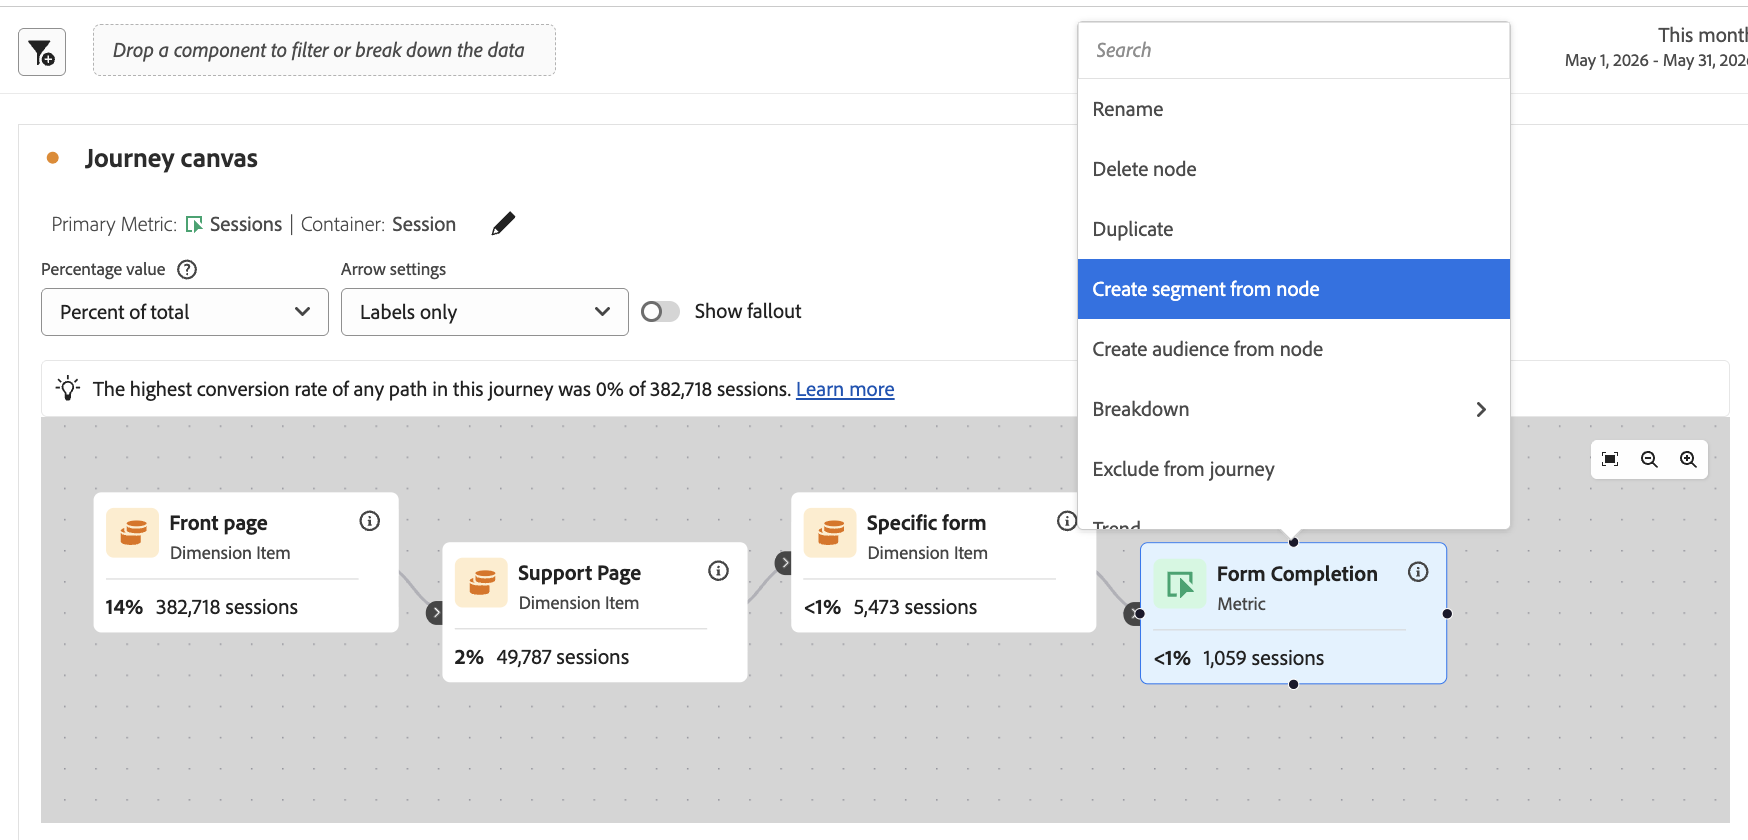
Right-click any node in the canvas and you get a context menu. Create segment from node generates a segment for users who reached that specific point in the journey. Create audience from node does the same but publishes it to AEP for activation. So here you get two different ways of creating an segment depending on your goal.
This is the fast path for questions like:
- Who are the users that reached the support page before the form?
- Who completed the form after the specific flow I defined?
- Who dropped out exactly at this step? what did they do after?
The segment definition matches the path logic you already configured in the canvas… so the sequence itself and the container level. You don’t have to reconstruct that logic in the Segment Builder. The canvas already built it. All you need to do is hit that save button 💾
Using the Next/Previous Page Panel
The Next/Previous Page analysis also creates a segment built around sequential behavior… what page came before or after a given point.
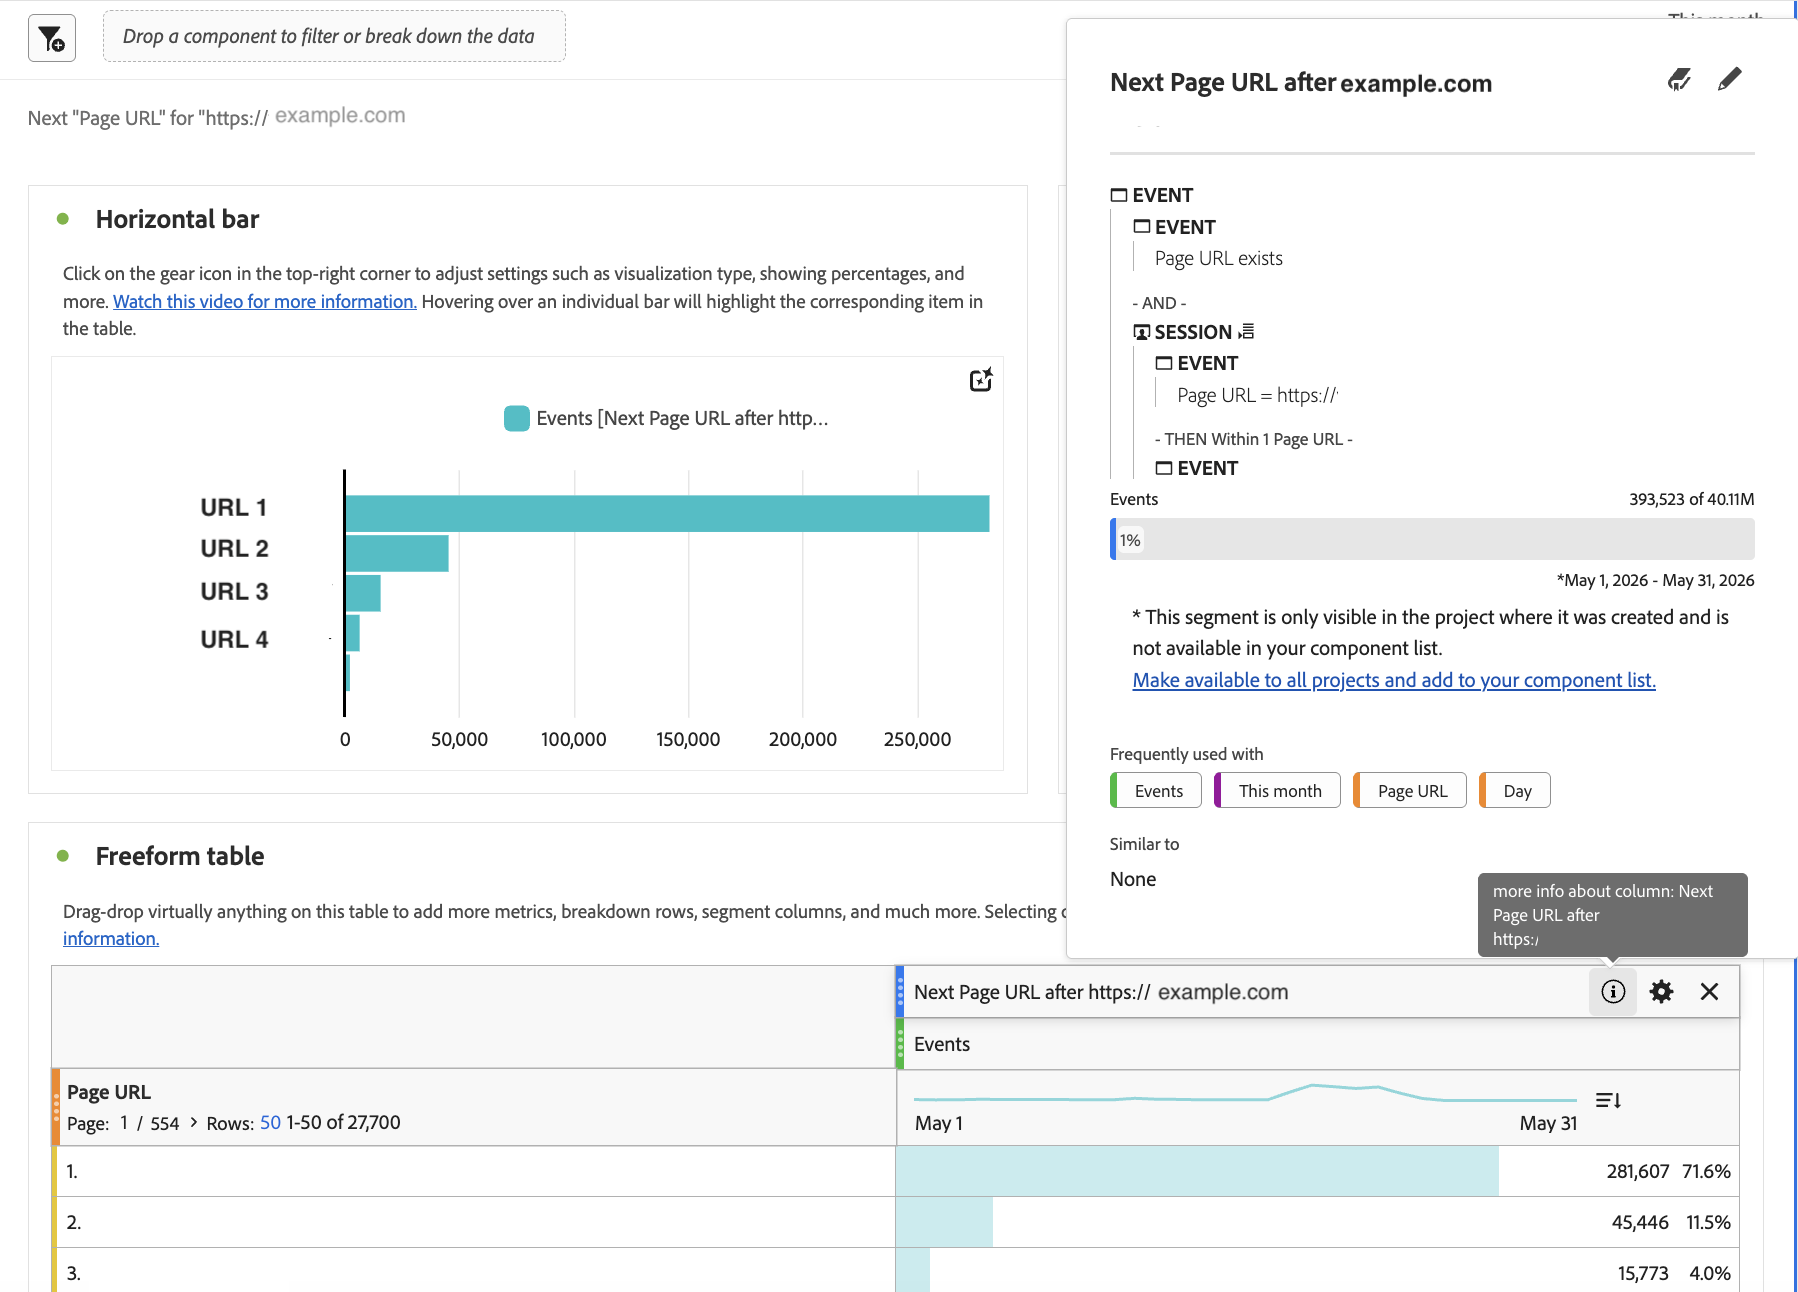
The segment definition created reflects the sequence logic: Page URL = X, THEN within 1 page, Page URL exists. That is a sequential segment. It basically lets us see the specific page views that come immediately after a specific page was visited. So not just any page that came after it at some point, but the very next one.
The “Non-repeating instance”
I think this is the smart thing about this segment. Even though it was automatically created, it contains a solid logic. The “Non-repeating instance” part means it ignores consecutive duplicate URLs. By that, I mean if someone refreshes the same page it doesn’t count as a new step. It’s often a segment configuration that can be missed.
The “THEN EXCLUDE Page URL exists”
If you open up the segment, you’ll see “THEN EXCLUDE Page URL exists” (the red one at the bottom). This is also clever. Without this, the segment would match any page that ever came after the chosen page URL in a session. It means that there is no further page URL after this one in the sequence. That’s what makes the table show the immediate next page only and not a page from three steps later. Nice.
Fallout: Segment at each touchpoint
Fallout is probably one of the most familiar visualisations here. The segment capability is straightforward: click on any touchpoint in the funnel and you get the option to save the population that reached it (or didn’t).
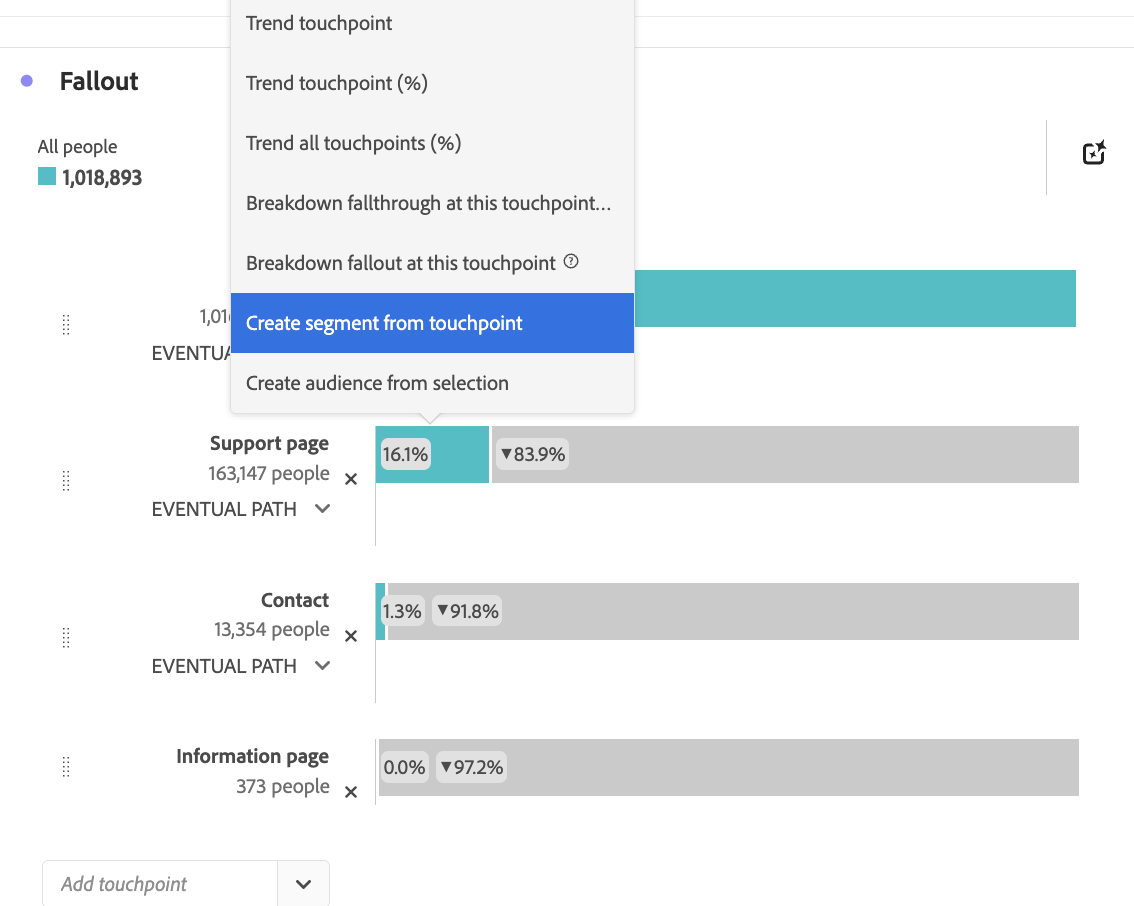
If you’re working through a funnel analysis and realize one step has unusually high drop-off, you can save that drop-off population as a segment immediately and pivot to analyzing who they are. No need to leave the panel, no need to re-specify the touchpoint.
One thing to keep in mind
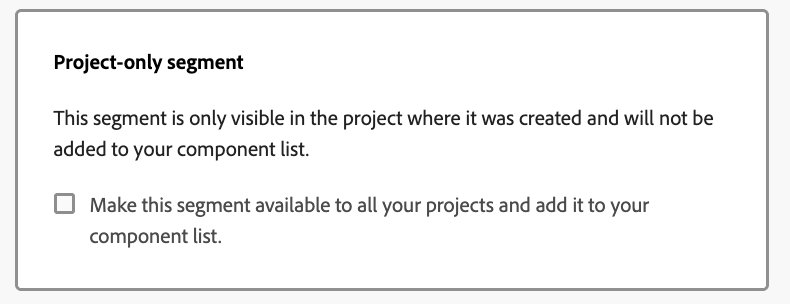
Auto-generated segments are project-scoped by default.
There’s a banner with a check-mark when you open the segment. Click on it to make the segment available across all projects. Easy to miss, easy to fix.
The underlying pattern
All of these shortcuts share the same logic: the visualization already knows what the segment is. It built the chart using that definition. The “save segment” option is just a way of making that definition portable.
The practical benefit is accuracy. Segment Builder is useful for building from scratch, but you don’t always have to do that. If you have a specific sequence or logic, try first setting it up in a visualisation and use the auto-generated segment. It’s great at applying advanced logic and accurately represent the journey that you have mapped out.
It also makes exploration faster. If you’re running through a question quickly and something looks interesting, you can save the relevant population in two clicks and keep moving. The segment is there when you need it.
Some segments genuinely need to be built from scratch, with custom nesting and logic that no visualization would produce on its own. But a lot of the segments we build manually are ones the tool would have created for us anyways .. if we’d looked for the shortcut first.
Join the discussion
Leave a comment