I’m genuinely excited about the new sub-event analysis capability in CJA. It’s already become something I include by default whenever I’m building anything at the product level, and that alone earned it a proper writeup.
For my own understanding, I tried to visualize what was actually going on, and I wanted to share that with others too. I’ve always found it easier to think in pictures, whether that’s a dataset, an architecture, or anything in between.
In this post, I’m showing how I’ve been using sub-event analysis so far.
Event scope vs. sub-event scope
First, let’s look at what this feature is actually all about.
If you’ve recently been poking around in the Data View settings and noticed a new tab called “Containers”, you might have had the same reaction I did: “was that always there?” quickly followed by “how have I not noticed this before?”.
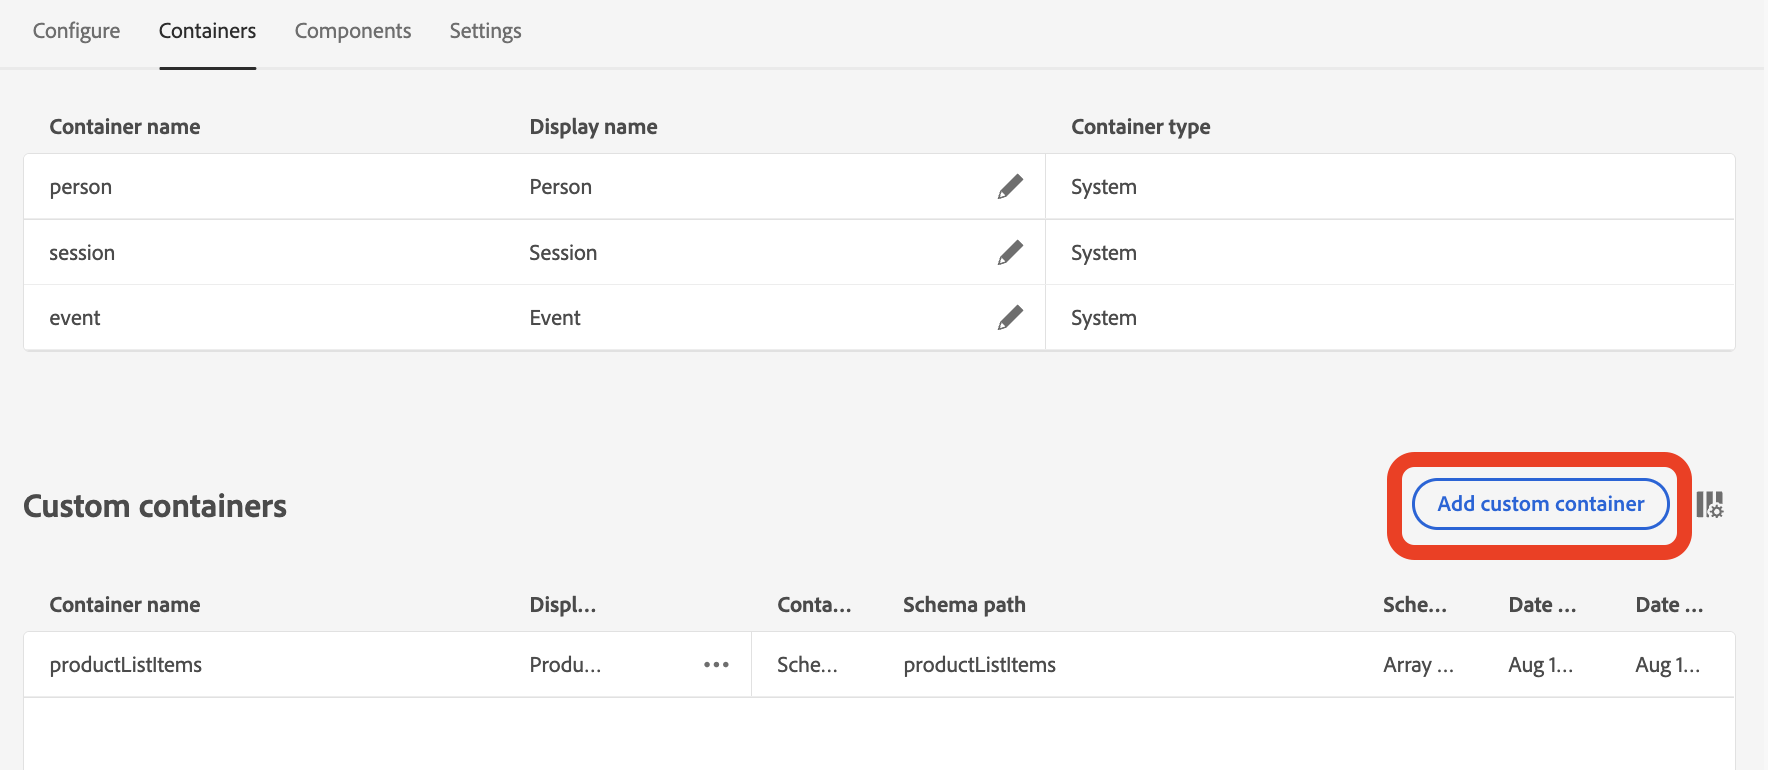
That tab lets you do two things. You can rename the existing containers, person, session, event, and you can build a brand new 🌟custom container🌟, which is where it actually gets fun. This is where you’d define a custom container for something like product details.
A custom container has to be built on an object or an array, because it represents a smaller scope than the event itself, the smallest one yet: a list living inside the event.
Here’s the short version: we can use productListItems as the example. This is an array. While the commerce.order event can carry four, ten, thirty product line items inside it.
Most dimensions and metrics in CJA are scoped to the event they belong to, not to the individual entries inside that array. So when you filter by something that only lives on the product array, like category, CJA has to decide: do I keep the whole event because one item in the array matched, or do I only keep the items that matched?
That is something you can now decide with the segment scope setting, and it changes your numbers dramatically.
⬇️Take this order⬇️:
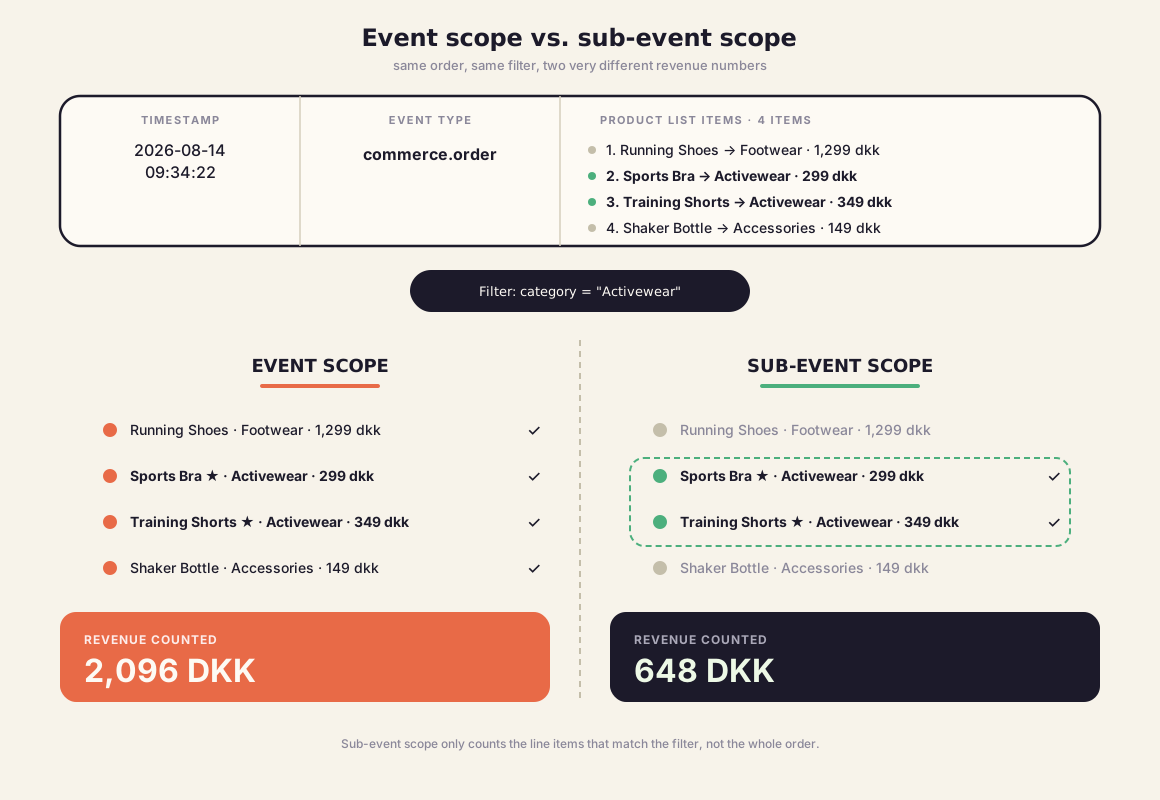
This is the same order with the same filter definition, category = "Activewear", except we’re applying two different scopes to it.
- Event scope: one item in the array matched Activewear, so the entire event qualifies. Every product on that order counts, including the running shoes and the shaker bottle. Revenue counted: 2,096 DKK.
- Sub-event scope: only the array entries that actually match the filter count. The running shoes and the shaker bottle drop out. Revenue counted: 648 DKK.
It’s not that one of them is wrong. They’re just answering different questions.
Event scope looks at “how much revenue came from orders that included at least one Activewear item”
Sub-event scope looks at “how much revenue did Activewear items themselves generate”
If you’re doing category or product-level analysis and you’re actually interested in the second question, but your components are built at event scope, you are systematically overcounting, and every co-purchased item is inflating the number of the product you’re trying to isolate.
How to set this up:
It’s pretty quick to set up.
Go to you data view.
Start with the container. For instance you can create one for product analysis. Then you’d need to use productListItems (it has to be a list).
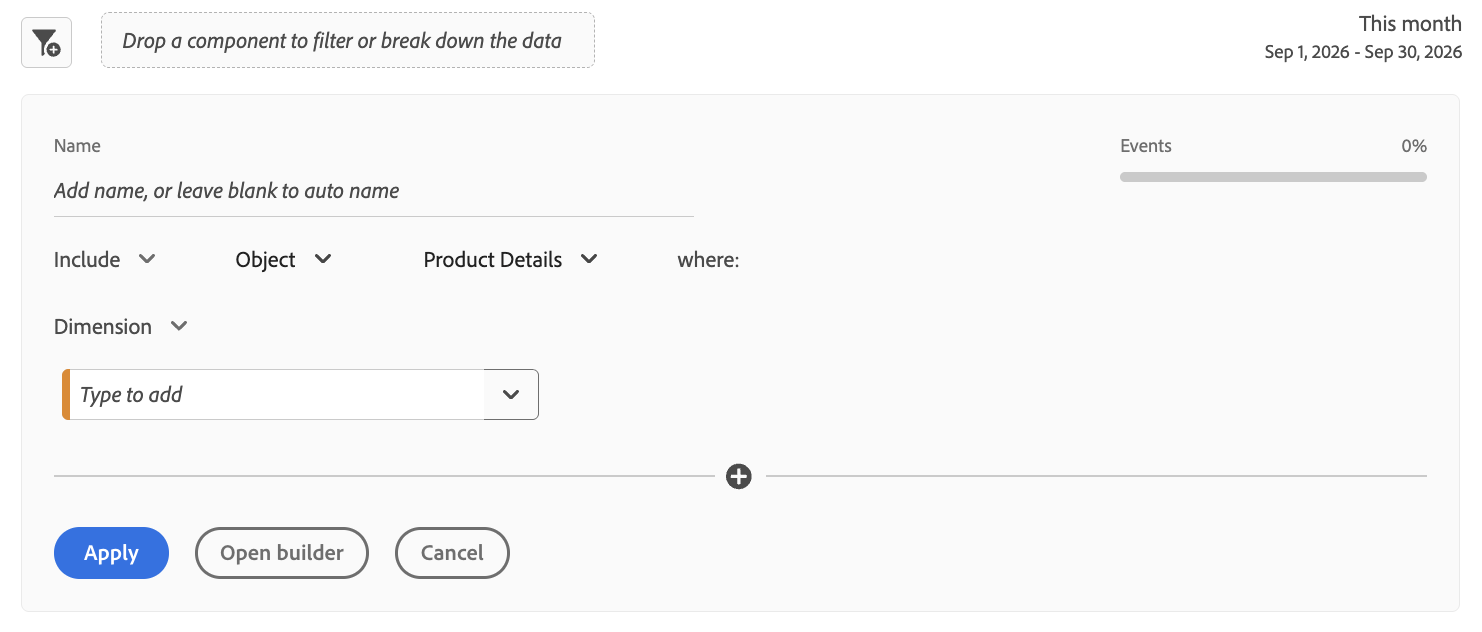
Then create a segment with an object scope. That can be a quick segment or via the segment builder.
Applying it to a product performance matrix
There are many ways to do a product performance analysis. This is one way of doing it.
The idea itself isn’t new, it’s a straight lift from the BCG growth-share matrix: stars, cash cows, dogs, question marks, plotted on a 2x2 with a couple of axes and bubble size as a third dimension. just built in CJA.
Now I can get pretty specific with the product category. As an example, I am only interested in the Activewear brand. But when I used the event scope, I kept seeing other brands as well. Since customers were usually browsing and purchasing more than one brand. Then I had to do extra work to filter those brands out. But now I can actually select the brand from the productListItems and only see the products within Activewear in my visualisation.
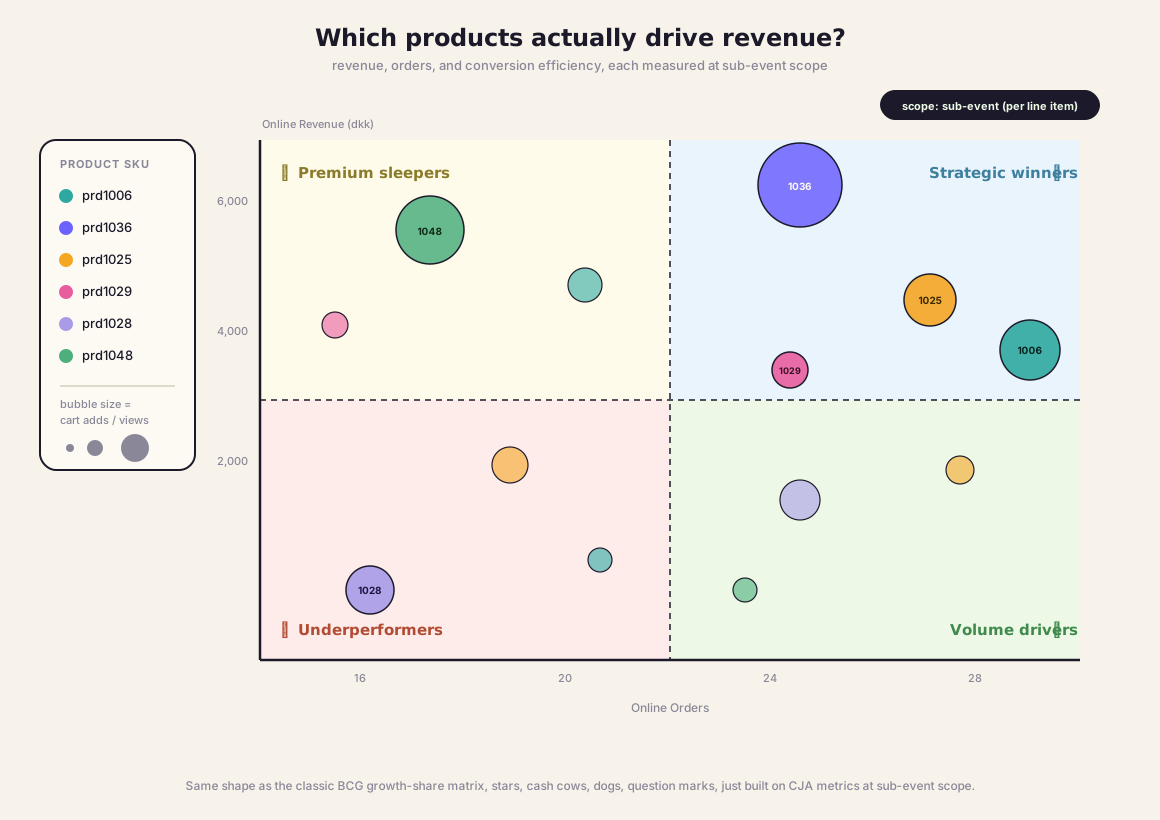
- X-axis: Online Orders
- Y-axis: Online Revenue
- Bubble size: Cart Additions ÷ Product Views (a rough conversion-efficiency ratio per SKU)
Here’s how it would look in CJA:
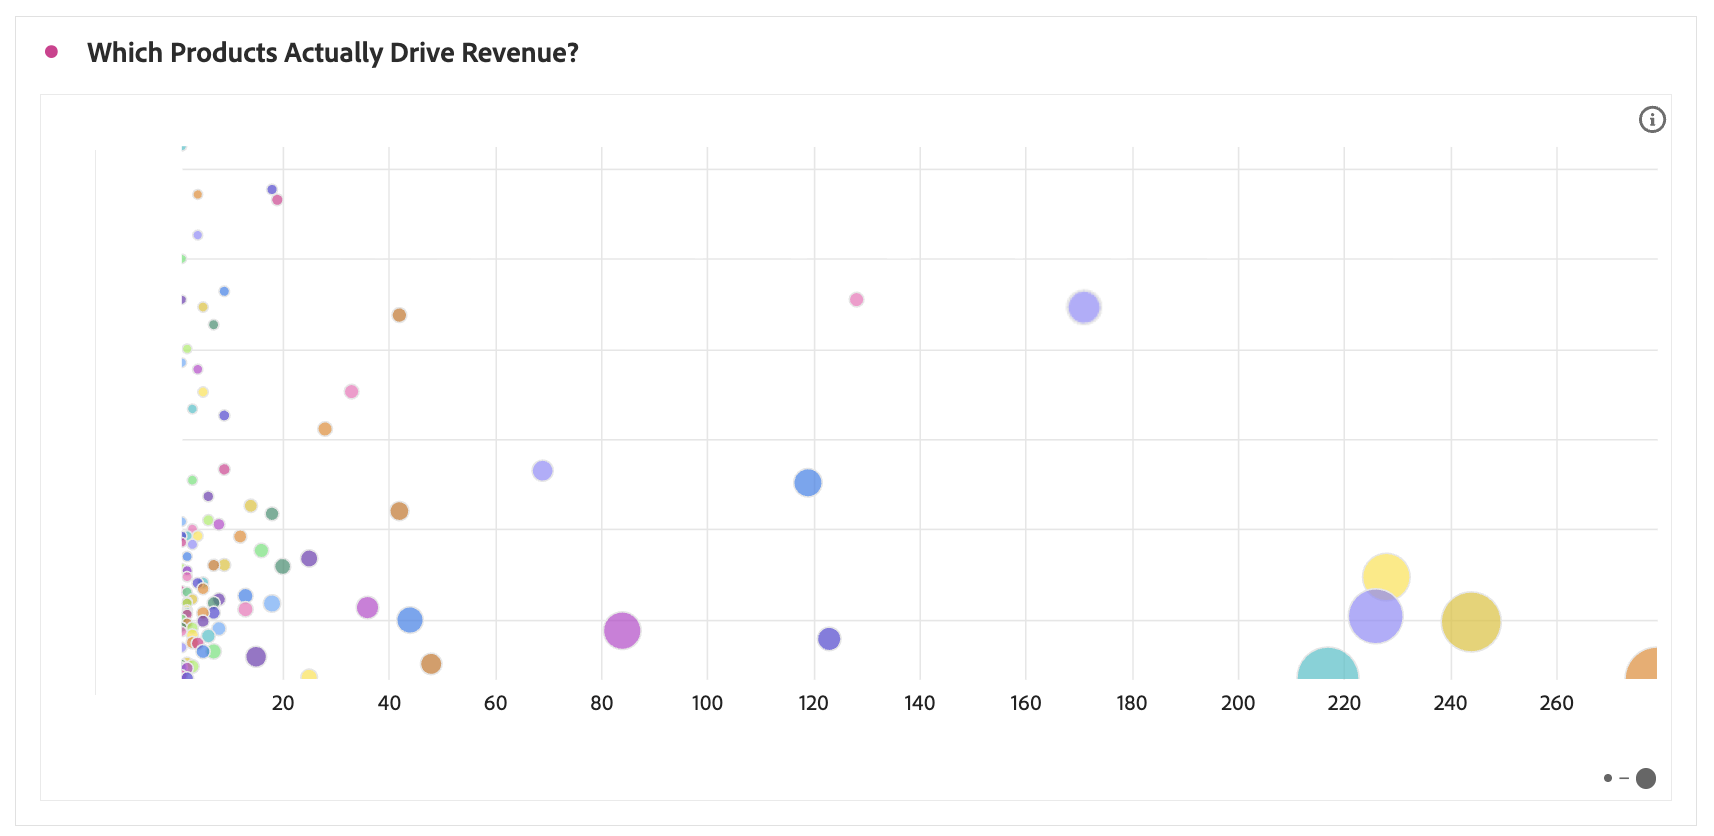
I added the object scope to the panel.
Here’s why it matters so much for this specific chart. Say Product 1 is a cheap accessory that frequently gets added to carts alongside Product 2, a high-ticket item from Activewear. At event scope, Product 1’s “Online Revenue” absorbs Product 2’s revenue every time they’re bought together, because the order qualifies as a whole. The bubble drifts up and to the right. It starts looking like a Strategic Winner. It is, in reality, a cheap accessory nobody would buy on its own, quietly riding shotgun on someone else’s revenue.
At sub-event scope, Product 1 only gets credit for what it actually sold for. The bubble lands where it belongs, in Underperformers, and the quadrant becomes something we can actually make a merchandising decision from: feature the Strategic Winners, investigate the Premium Sleepers (good margin, low volume, why aren’t more people finding them), reconsider the Underperformers, and don’t over-invest in Volume Drivers just because the order count looks healthy.
Other places I want to try this
A few ideas I haven’t fully built out yet, but the same logic should apply anywhere a visualization pulls a metric or dimension straight off an array field:
- Cohort table, scoped to the SKU. Standard retention answers “did this person buy anything again.” A cohort built on a sub-event scoped metric could answer “did this person buy this exact product again,” which is a much sharper repeat-purchase signal for a specific SKU than session or order-level retention.
- Venn diagram of product overlap. Who bought Product A, who bought Product B, and where the circles cross. I’d want to test the “bought A but not B” ring.
- Attribution IQ per product. Most attribution analysis lives at the order or conversion-event level. Scoping the conversion metric to a single product line item before running attribution would show which channels actually drive a specific SKU, rather than which channels happened to drive an order that included it somewhere in the cart.
These are visualizations that you can use in Workspace. The only thing that changes is remembering to check that the scope settings are set to object.
The underlying pattern
Event scope and sub-event scope aren’t a bug and a fix. They’re two legitimate answers to two different questions, and CJA defaults to the one that’s usually right at the order level.
The fix isn’t complicated once you know it exists. It’s simple to set up in the data view and to start using in workspace.
Join the discussion
Leave a comment