I wanted CJA data inside a Power BI report without going through hours of setting up some sort of connection, redefining metrics in DAX and just redoing a lot of stuff. Luckily, that was not too much to ask for.
Adobe already built the bridge for this: the BI extension, a Postgres-compatible interface that sits in front of your CJA dataviews. All I gotta do is point Power BI’s native PostgreSQL connector at it, and then i’m querying calculated metrics, segments, and dimensions directly from one of my dataviews.
The setup itself is genuinely quick once you know the shape it expects. This post walks through it.
Prerequisite: credentials
You will need Postgres-style credentials for AEP/CJA (a host and a database string, something like yourorg-prod:cja). Get these from whoever administers your AEP org.
✧˖° Lets get started ✧˖°
Now I’m going to walk you through how I got the metrics and segments I created in CJA into Power BI. One more thing, I actually used the PBI browser-version.
Step 1: Connect
In Power BI: Get Data → PostgreSQL database,
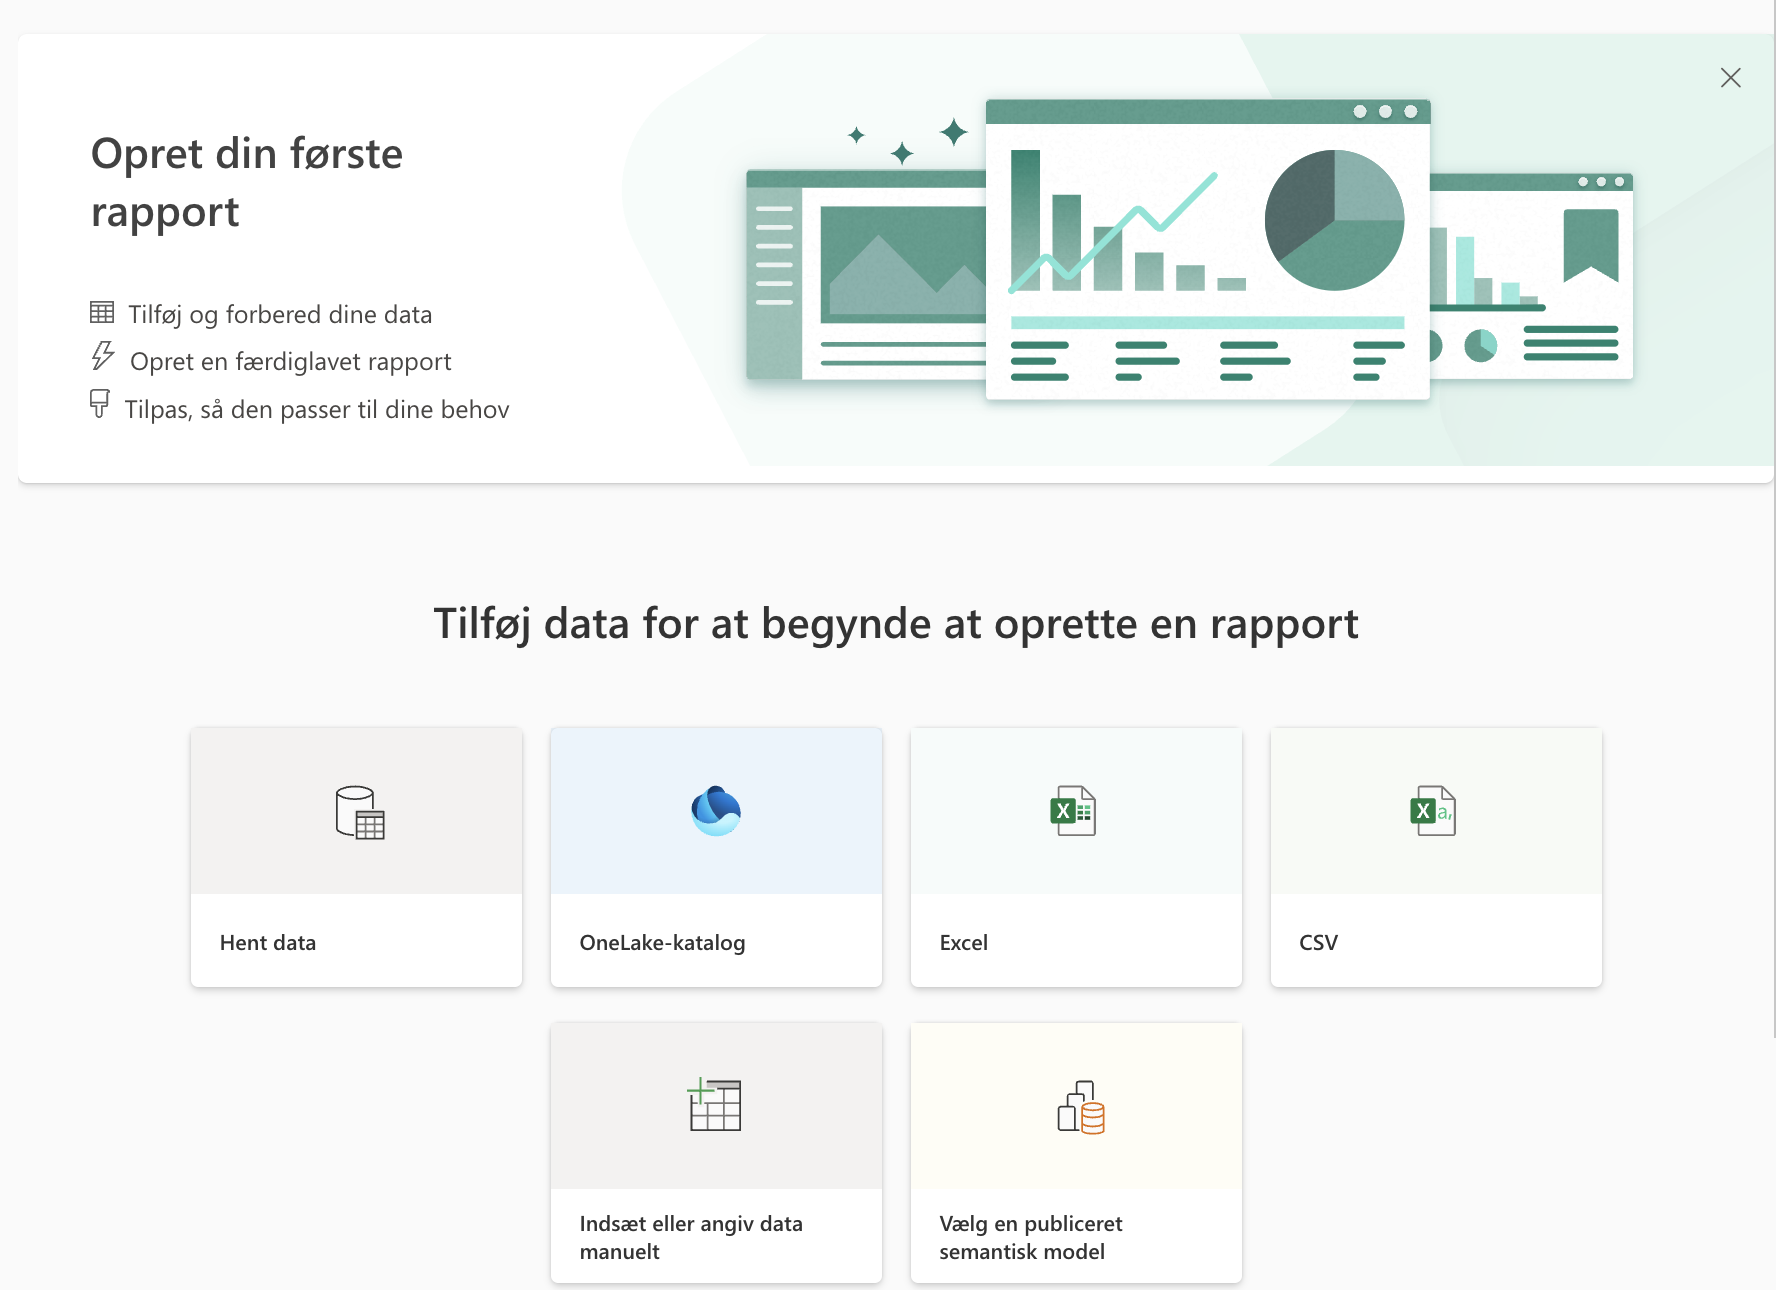
(っ◔◡◔)っ then:
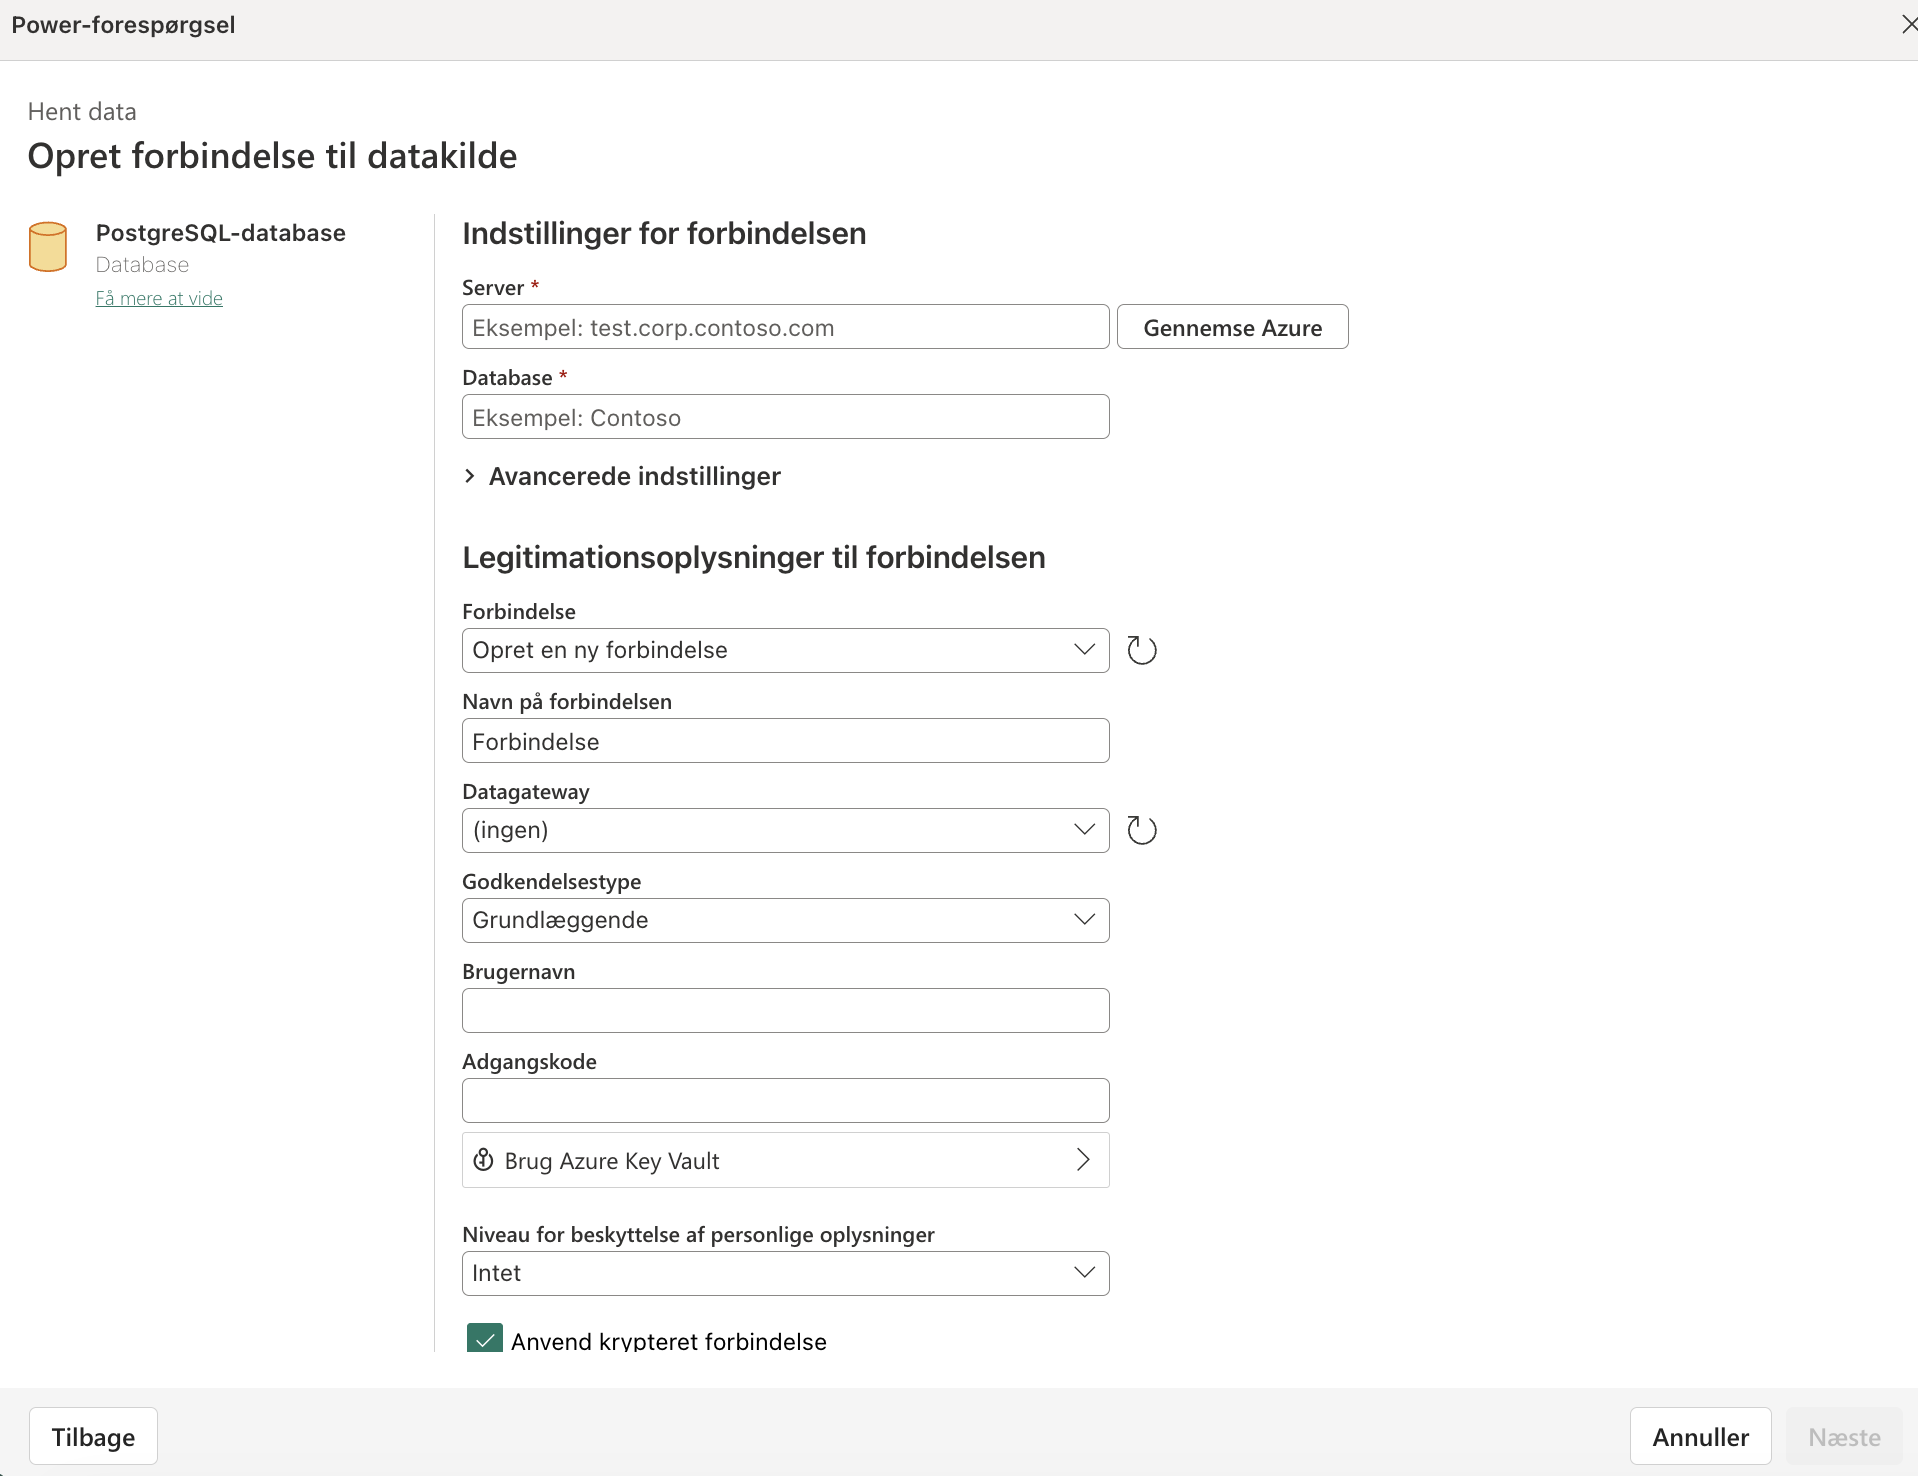
- Server: your AEP query host, e.g.
XXX.platform-query.adobe.io - Database:
<your-database>?FLATTEN
Do not forget to add ?FLATTEN. CJA’s data schemas are nested XDM - that is basically how the data is structured, and this flag flattens it into plain columns that any BI tool can actually work with. Without it, you are staring at fields that Power BI cannot make sense of. I learned that the hard way (not having read the entire documentation).
¯\_(ツ)_/¯
I think of it like this: nested XDM data is folders inside folders inside folders. ?FLATTEN pulls every file out into one drawer, so you can just grab all your metrics by name instead of digging through nested folders to find it - totally inception-style (I hope you’ve watched the movie).
So that one flag is what makes every simple SUM(column_name) later in this post actually work.
You can also find the instructions here: Customer Journey Analytics BI Extension
Step 2: Know the three rules
Quick note before we get into it: a “query” here just means a request for data, sent to Adobe behind the scenes. It does not have to be something you type yourself.
I had to recap a lot of PBI-stuff when looking into this. But to simplify it: if you drag a field onto a chart in Power BI (creating a visualisation), Power BI writes a query for you and sends it off. So these rules apply either way, whether Power BI is writing the request for you, or you end up writing it by hand later… like me…in this post.
Moreover, CJA’s BI extension is built specifically for reporting-style aggregate queries. That means we have to consider these three things:
- Every query must be aggregated. So this is pretty important.
SELECT * FROM viewwill not give you raw rows, you get a message back saying an aggregate query is required instead. Wrap your metric inSUM(),COUNT(), etc. - Every query needs a bounded date range, using the special
timestampordaterange/daterangedaycolumns. Skip it, and you silently get the last 30 days by default which is easy to misread as “no data” if you were not expecting that. - Results are capped at 50 rows by default, up to 50,000 with an explicit
LIMIT n.
Here’s a cute visual:
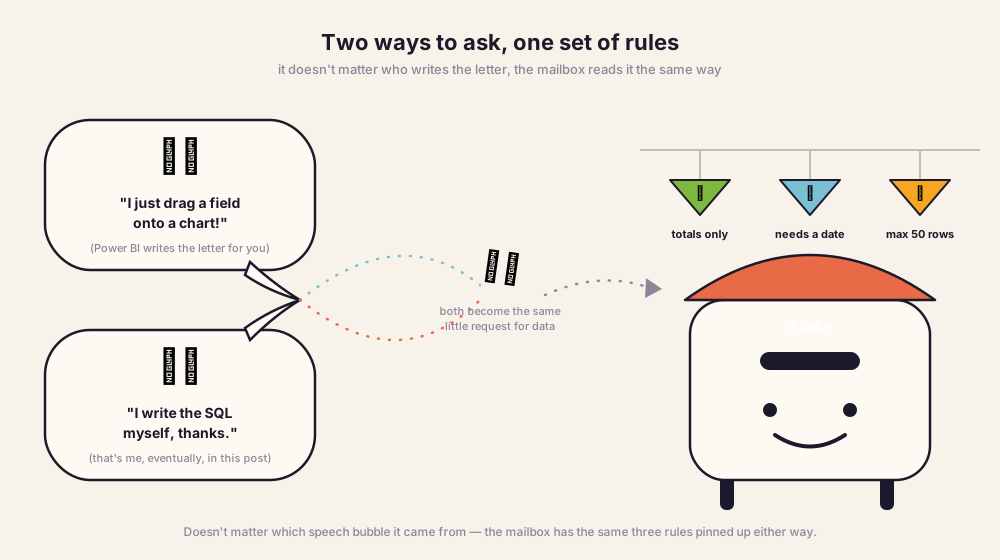
These are just really good to know.
Step 3: Find your real column names
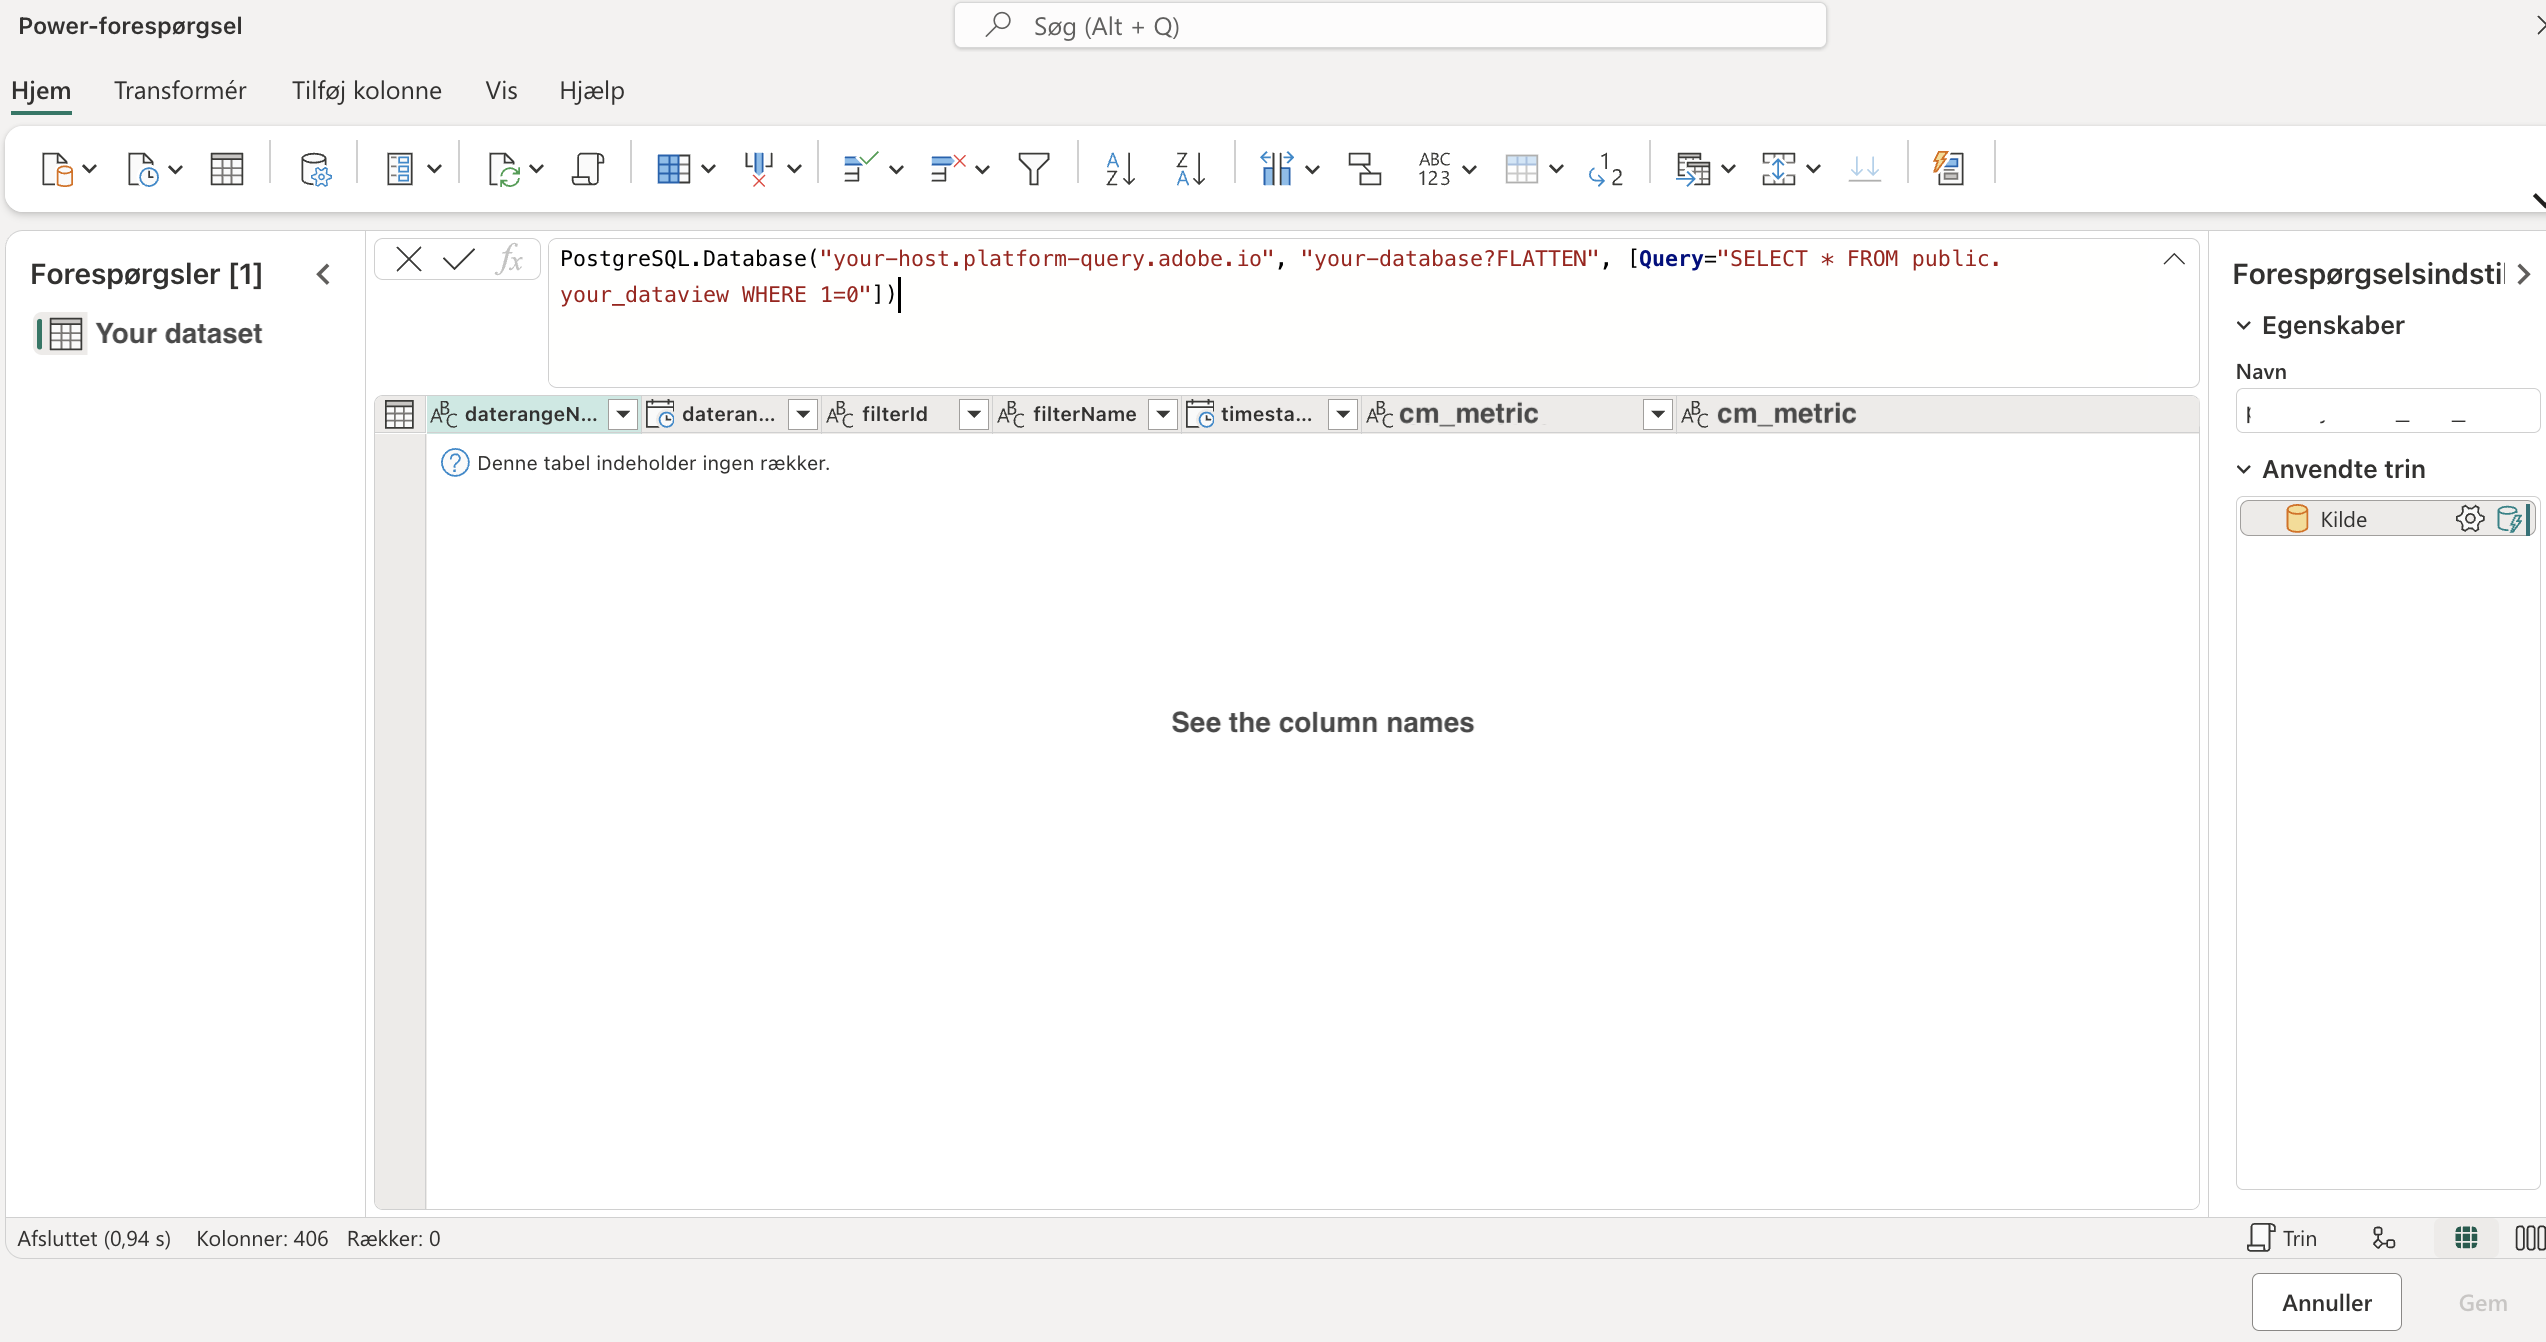
I wanted to be sure that I was using the correct column namings so I went straight to the source. This pattern is explicitly supported for schema discovery and returns zero rows but the full column list:
PostgreSQL.Database("your-host.platform-query.adobe.io", "your-database?FLATTEN", [Query="SELECT * FROM public.your_dataview WHERE 1=0"])
Look at the header row, and you will find your dimensions and metrics, including custom/calculated metrics, usually labelled with something like cm_. So the namings have been changed slightly, having the cm_ added to them. Knowing that, I could create my query more easily.
Step 4: Write the query
Click on Transform Data:
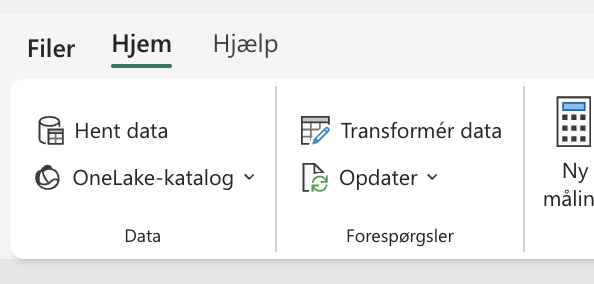
Edit the source step to something like:
PostgreSQL.Database("your-host", "your-database?FLATTEN", [Query="
  SELECT daterangeday,
         SUM(metric_1) AS metric_1,
         SUM(metric_2) AS metric_2
  FROM public.your_dataview
  WHERE `timestamp` BETWEEN '2026-06-22' AND '2026-07-22'
  GROUP BY daterangeday
  ORDER BY daterangeday
"])
- Quote the special
timestampcolumn with these:``, not double quotes. - The first time you run a hand-written query, Power BI will probably show a native-query security prompt. That is expected behavior for any raw SQL source, not an error , click through it.
The datamodel might look something like this:
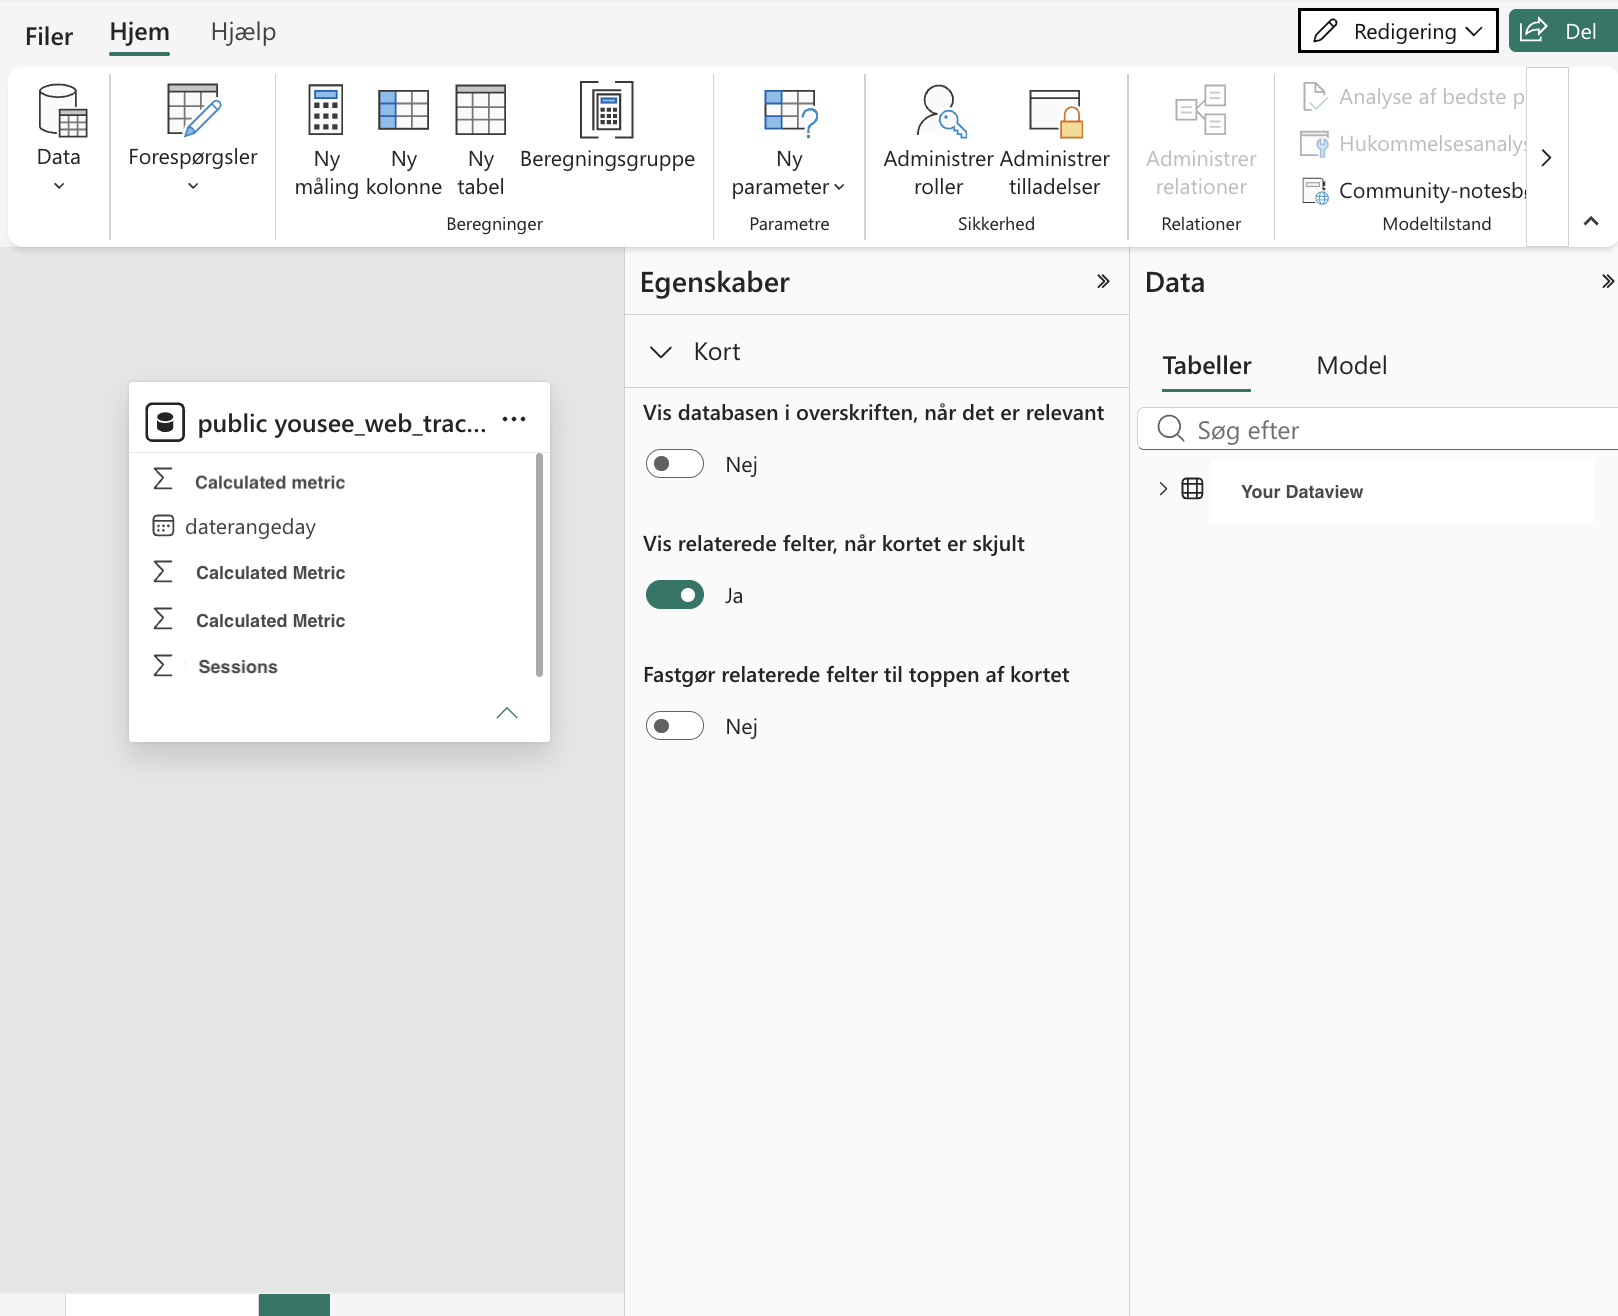
Why use raw SQL? Well I encountered some issues when trying to explore the full dataset in the reporting window in PBI. Initially I tried to make it work through drag-and-drop alone, no additional SQL query at all. I used Sum, a real date filter and avoided the auto-generated hierarchy. Nothing showed up though. Just got a blank table every time.
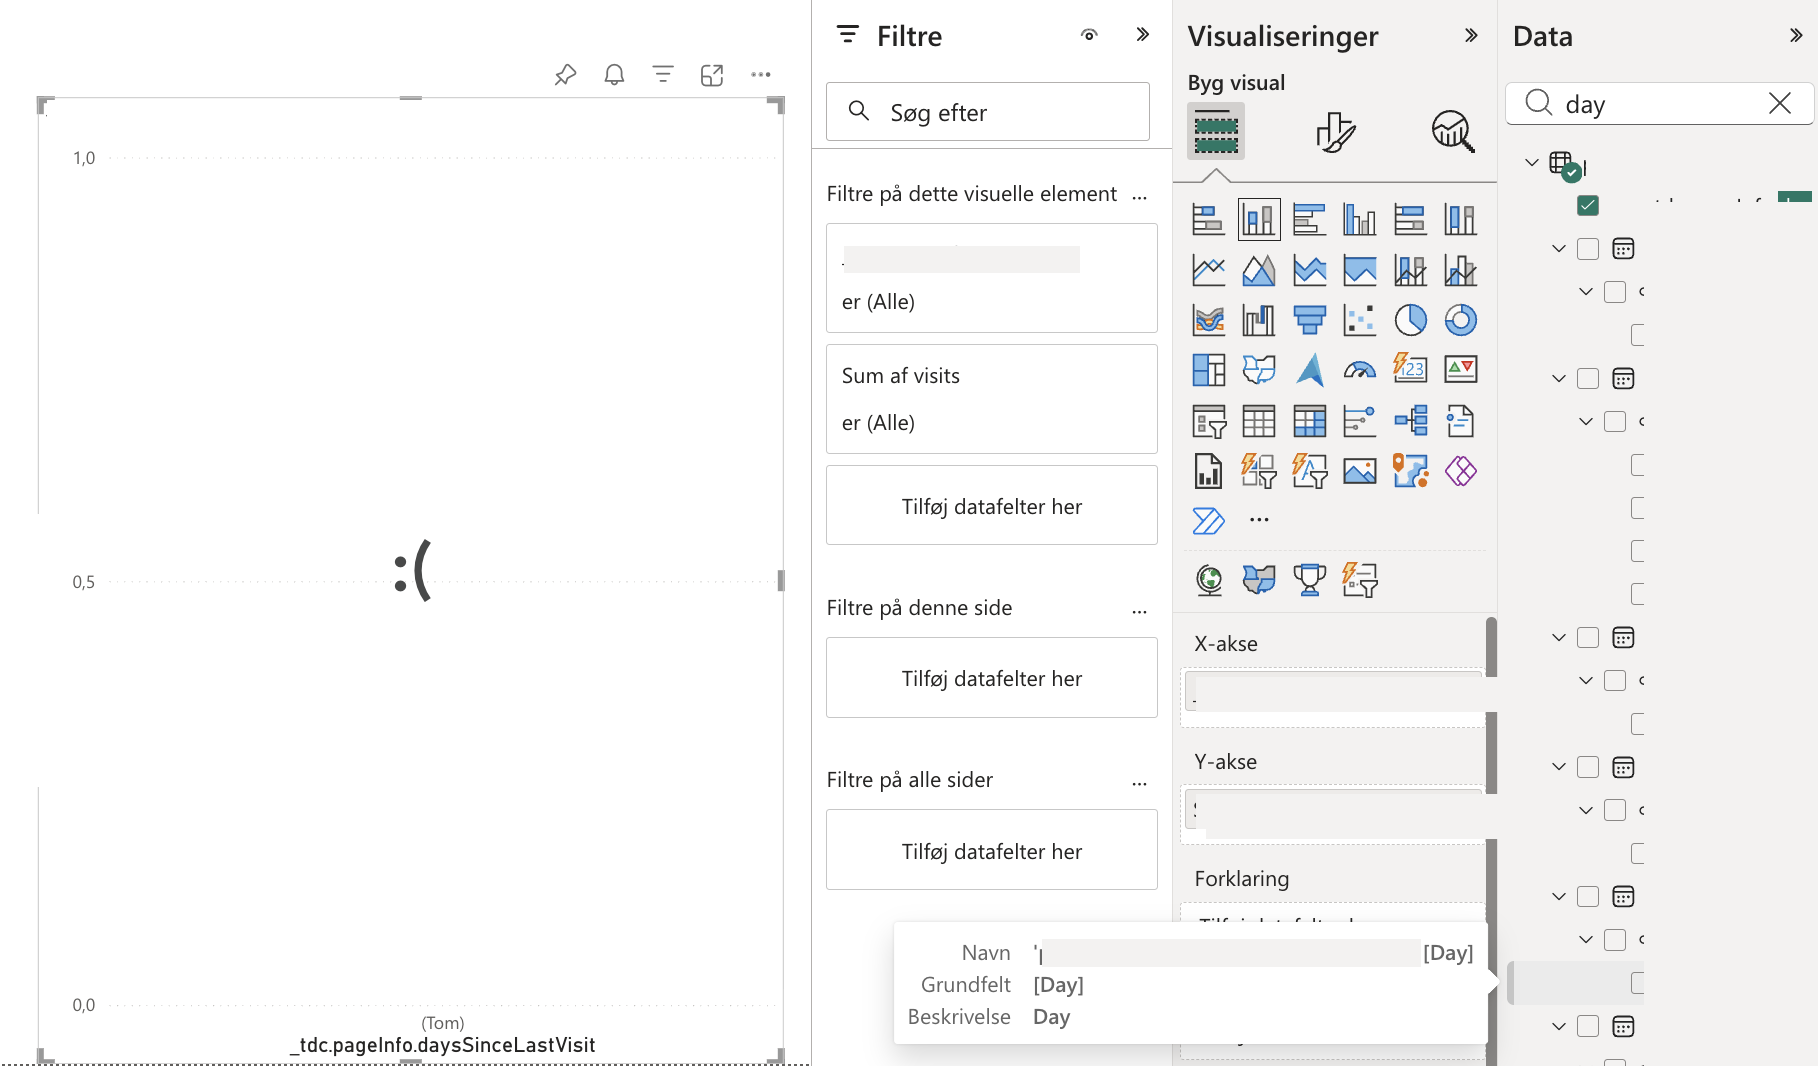
But adding a query where I specified the metrics and date range directly in the transformation step seemed to work fine.
As a nice side effect, it also got me the specific errors straight from the backend such as: “aggregate query required”
“unresolved column, did you mean X”
“Why didn’t you read the documentation(•̀ ᴖ •́)”
That is definitely is a much faster way to find out what actually broke and learn from that…at least that is what I tell myself after having spent an embarrassing amount of time on this one thing.
Step 5: Build the visual
Because the query already returns values grouped and sorted by day, the daterangeday behaves like a genuine date field once loaded. Then I dropped it on an axis, and Power BI’s built-in Year → Quarter → Month → Day hierarchy works exactly as expected - drill from a yearly total down to a single day, in the same visual. That’s it.
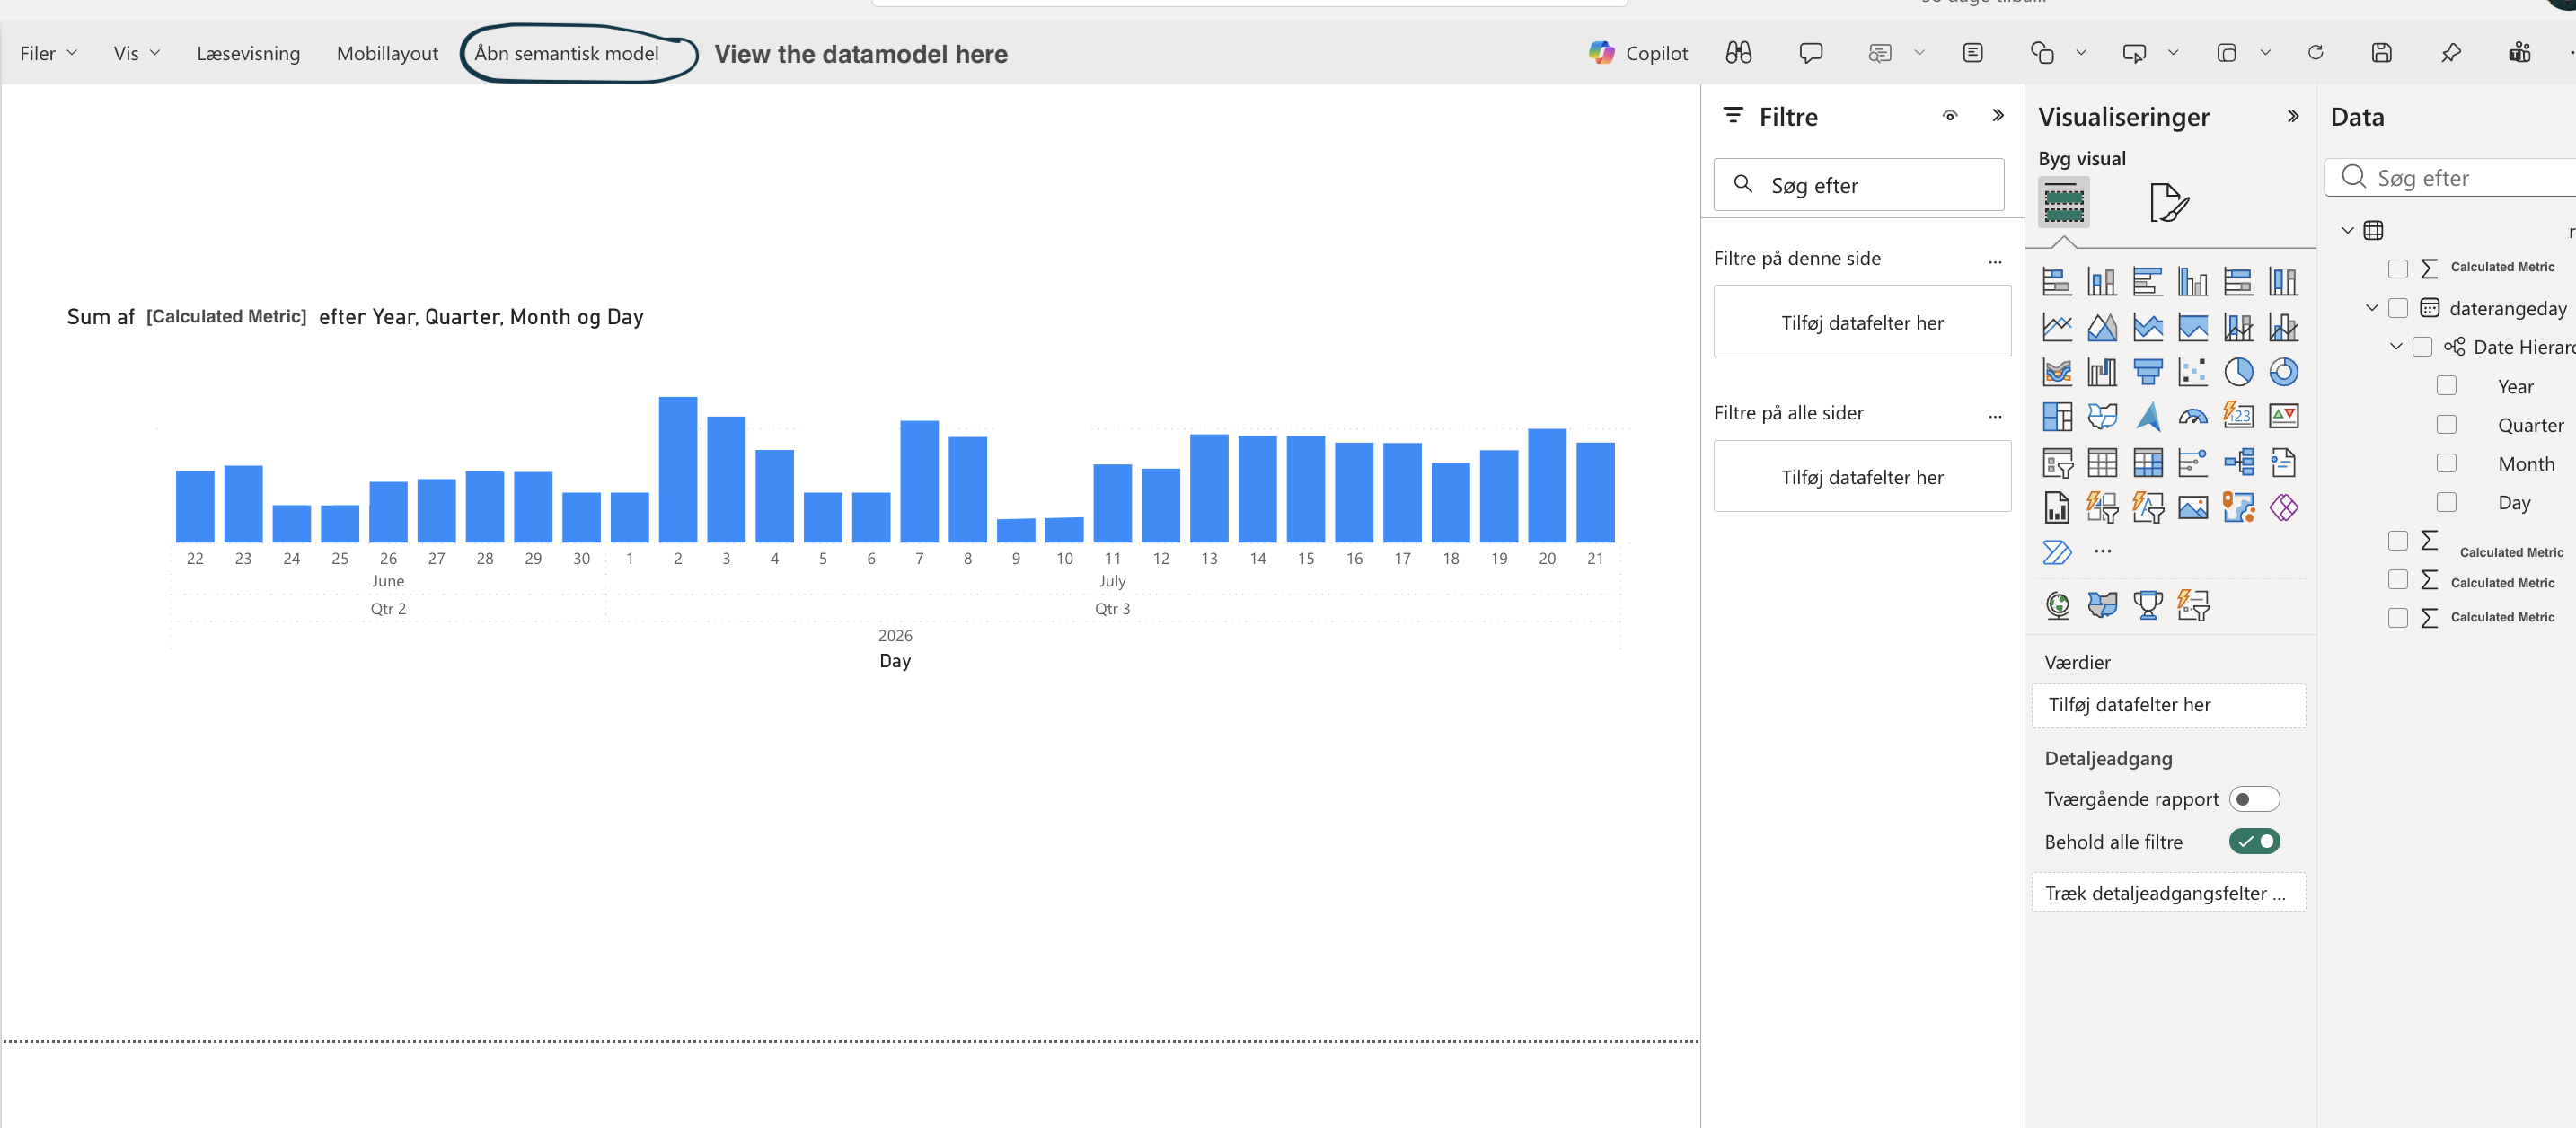
The condensed version
- The Non-expiring credentials are essential and handled once.
- Always add
?FLATTENto the database string. - Every query: aggregated, and date-bounded.
SELECT * FROM view WHERE 1=0to get real column names instead of guessing from a report label. That was just for exploration.- Write the SQL in Power Query.
- Once the query is right, Power BI’s native date hierarchy and visuals just work. No further wrestling needed.
That is really the whole thing. Once you have the right credentials and know the rules and, setting up a CJA dataview into a Power BI report can be a five-minute job. ❀◕ ‿ ◕❀
Join the discussion
Leave a comment