One of the things I enjoy most about Customer Journey Analytics is how quickly you can reshape your analytics lens… without ever modifying the original data. I’m comparing with how report suites in Adobe Analytics are designed - mostly for receiving the data in containers as eVars, props and metrics. Not leaving much room for data transformation after hitting the Analytics server. Of course you could tend to the pre-processing phase. There are definitely some options for preparing the data for the specific report suite such as IP exclusion or the processing rules. But these layers would leave permanent marks of the data.
Data Views works very differently. There are a lot of ways to prepare the data before it’s made available for a team to analyze in workspace.
But quite often the Data View gets set up. Fields get dragged in. Things get named. Workspace opens. Everyone is happy. Meanwhile, a lot of great data definition and governance opportunities are left on the table.
And then the team spends the next six months manually applying the same segments, asking what a metric actually counts, and wondering why their page name dimension has three rows that are clearly the same page.
Data Views is where CJA implementations go from default to deliberate. There is a whole layer of settings that most teams walk straight past. Each one takes a few minutes to configure.
Here are 8 times I realized that Data Views settings are pretty cool and worth revisiting.

1. Consider What a Session Actually Is
By default, CJA uses a 30-minute inactivity timeout. So if a user goes quiet for 30 minutes, a new session begins. That is exactly how Adobe Analytics worked. It is exactly what most CJA implementations still use today, because nobody changes it.
The setting lives in the Settings tab of your Data View, under Session Configuration. Two things you can change:
- Inactivity timeout: how long before a new session starts. The default is 30 minutes for web interactions. But you can apply longer windows when you are combining online and offline data. So it really depends on the purpose of the data view.
- Conditional session restart: define a metric event that triggers a new session, regardless of inactivity. An app launch. A campaign parameter appearing in the URL. A new login event. Just keep in mind this will affect the number of sessions and everything included in that one session.
I think the practical win here is that you can have multiple Data Views with different session definitions. For example for your marketing team you can set up session resets every time someone arrives from a paid click if they need to analyze traffic as a separate marketing initiative.
2. One Checkbox Fixes Duplicate Dimension Rows
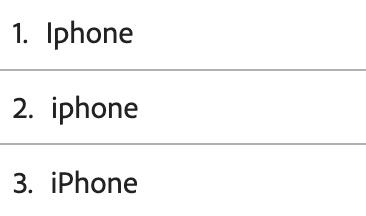
You have a page name dimension. It has 400 rows. About 60 of them are duplicates of each other, just written differently: Homepage, homepage, HOMEPAGE.
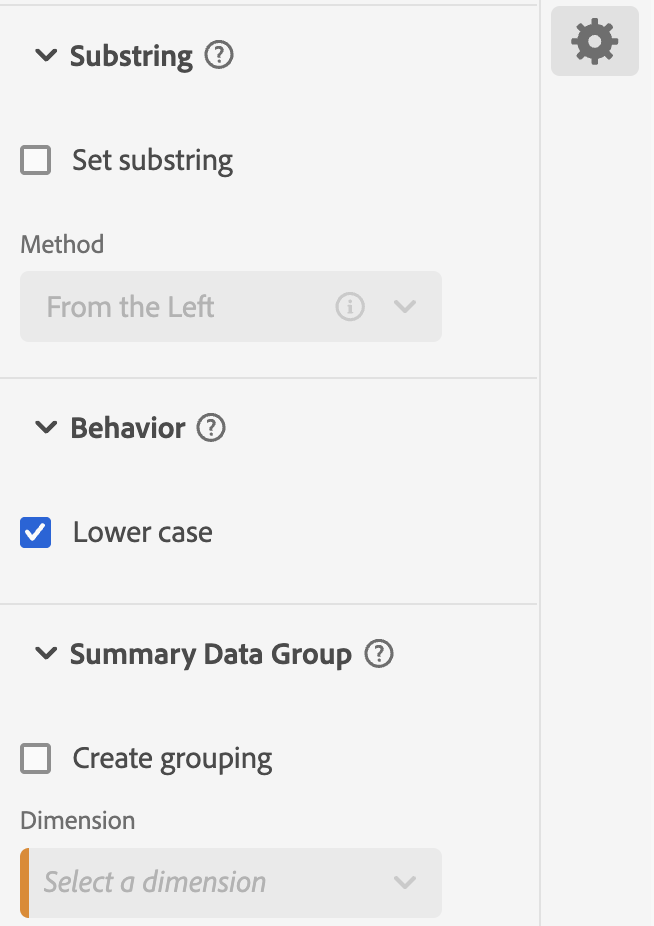
The fix is one checkbox.
Go to the component settings for any dimension, find Behavior, and enable Lowercase. Values like "contact", "Contact", and "CONTACT" consolidate into a single row. It applies retroactively. No derived field. No classification file. Just a checkbox. So remember that this can be done pretty easily without having to use any derived fields - you might only have 100 in your current CJA license.
This is most useful for page names, product names, internal search terms, and any dimension where the data comes from multiple sources or teams who never agreed on a casing convention (which is most teams).
3. Two Metrics…One Field
This is a really great functionality in CJA. Anyone coming from Adobe Analytics will appreciate the flexibility in defining dimensions and metrics based on just one dataset field. Here’s an example of using a specific field to create two different metrics.
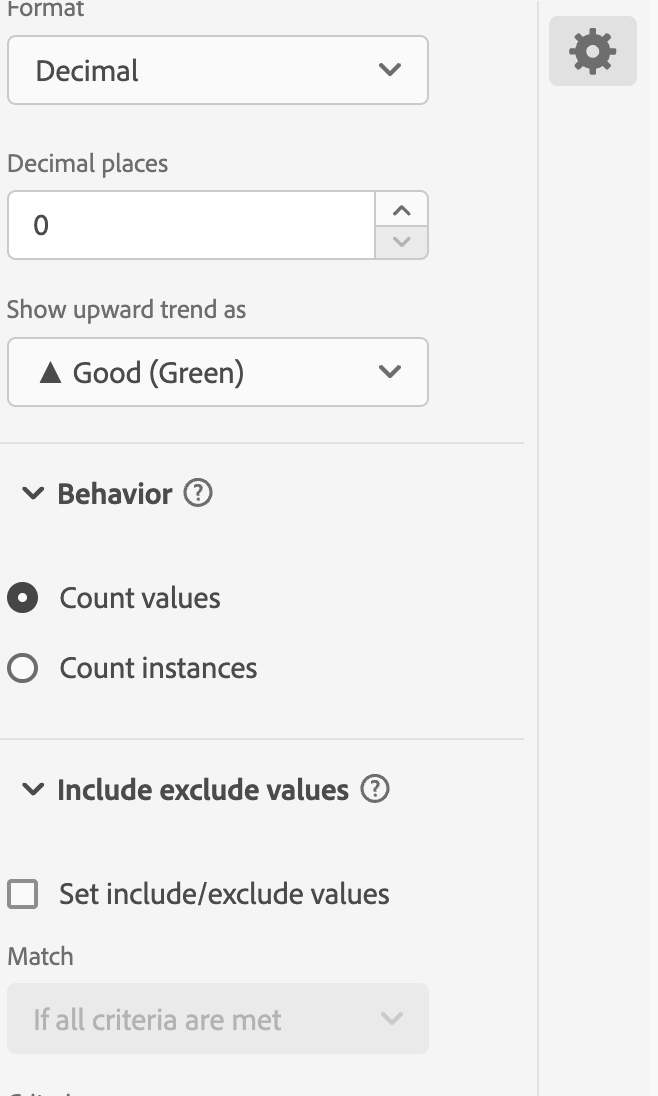
Go to the component settings and search for a numeric schema field (Integer or Double). Drag it into the metric section and look for Behavior in the settings. There are two options:
- Count values: sum the numeric value in the field.
- Count instances: count the number of times the field appears, regardless of value.
If you have call center data in your CJA connection, you likely have a field storing call duration in seconds. Add it twice:
-
Name one
Total Talk Timeand set it to Count values : it sums the duration of every call. -
Name the other
Call Volumeand set it to Count instances : it counts the number of calls, regardless of how long they lasted.
If you’d like a rule of thumb, think of it like this: If you want to know how many times did X happen then Count instances. If you want to know what is the total amount of X then Count values.
So here you’ve got two completely different metrics based on the same schema field.
4. Stop Counting the Same Purchase Twice
A user completes a purchase. The confirmation page loads. They refresh the page. Maybe your Orders metric just fired twice for one order. If your confirmation page is not protected against reloads, your order count is inflated. I think s.purchaseID was Adobe Analytics’ built-in answer to this problem.
In CJA it is slightly different. Here you can use the Metric Deduplication, found in the component settings for any metric.
You can set a deduplication scope: Person or Session. But the more powerful setting is the Deduplication ID. Instead of just deduplicating the metric event itself, you deduplicate based on a dimension value, like a Purchase ID or Transaction ID.
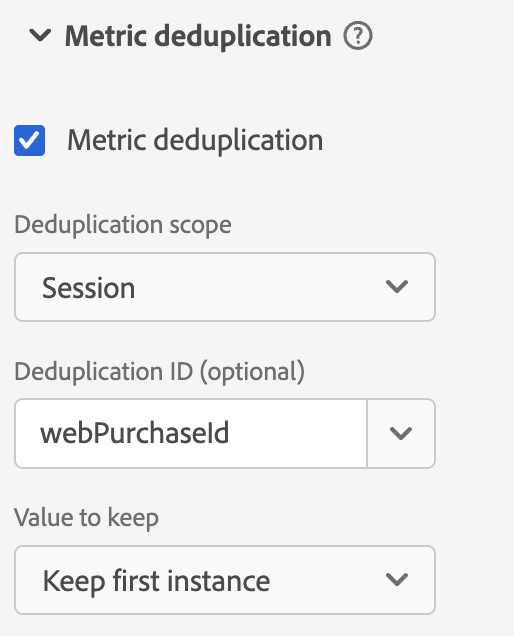
Set the scope to Session, use Purchase ID as the Deduplication ID, and now the same purchase only counts once per session, no matter how many times the beacon fires.
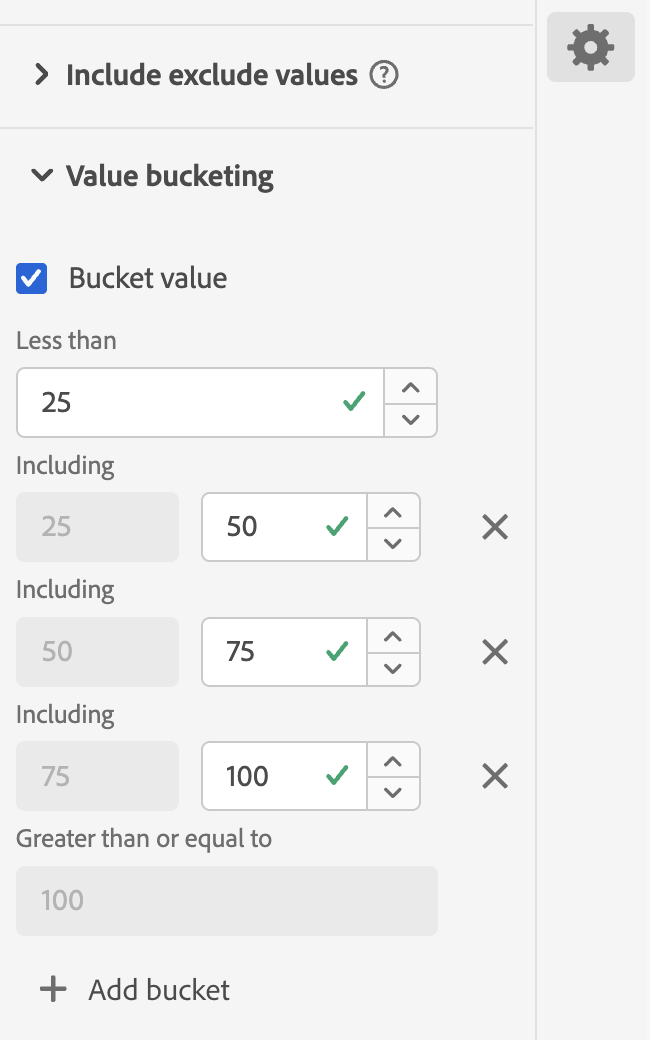
5. Pre-Built Buckets Without a Derived Field
I always like to remind everyone: CJA limits you to 100 derived fields per Data View. That sounds like a lot until your implementation grows and you start counting. I think there is a good way of managing this: only use a derived field when you genuinely need conditional logic across multiple fields. For simpler transformations, there are lighter options.
Value bucketing is one of them. You don’t need a derived field for this.
It applies to any numeric dimension (Integer or Double schema type). In the component settings, enable Bucket value, define your ranges, and you are done. For instance, you might be tracking scroll depth on your website. This can be bucketed so you can create a much easier overview of how deep visitors actually navigate on the site.
6. Rename “(No value)” to Something That Actually Means Something
Every report has that row. The one that just says (No value). The stakeholder asks what it means. You explain. The next person asks the same question. You explain again.
In the component settings for any dimension, under No Value Options, you can rename (No value) to whatever makes sense for that field.
Some examples that are immediately useful:
- Campaign dimension with no value: rename to
Direct / Untagged - Device type with no value: rename to
Desktop(if the absence of a mobile flag means desktop in your implementation) - Page name missing: rename to
Untagged Page - Login status not set: rename to
Not Logged In
You can also choose to hide the no-value row entirely if it is just noise.
The row does not disappear. The data is still there. But now it tells you something instead of asking you a question.
7. Parse URLs Without a Derived Field
Another one that peoblably ends up as a derived field when it does not need to.
If you need to extract something from a URL, check the Substring settings in the component settings before reaching for a derived field. The URL Parse method can deconstruct a full URL into its parts: protocol, host, path, query string values (by parameter key), and hash.
So if your page URL dimension contains values like https://example.com/shop/trainers?cid=email_summer&colour=blue, you can extract:
- Just the path:
/shop/trainers - The
cidparameter value:email_summer - The host:
example.com
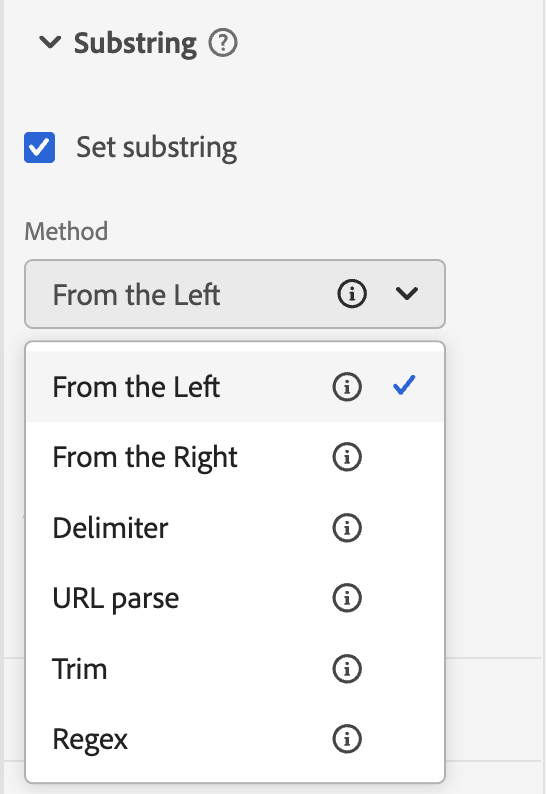
Just point the setting at the URL field and tell it what part you want.
8. Add Descriptions to Everything
This one takes might take more than just a few minutes for an entire Data View. But I am going to argue it is the highest return on time of anything on this list.
Every component has an optional Description field. Whatever you write there appears as a tooltip in Analysis Workspace when a user hovers over the component name.
Write one sentence per metric or dimension. What it counts. What to watch out for. Where it comes from.
Orders: Counts unique orders per session, deduplicated by Purchase ID. Excludes cancelled orders.
Marketing Channel: Classified using the channel classification logic. Updates daily. Direct traffic may include untagged campaigns.
Session: Defined as 30 minutes of inactivity. See the Marketing Data View for campaign-session definition.
The “what does this metric count?” Slack message is one of the most common questions an analytics team gets. Descriptions do not eliminate it entirely. But they catch a lot of it before anyone has to ask.
Final Thoughts
Data Views is the layer that determines whether your analysts spend their time on analysis or on cleanup. so I really think it is worth spending some more time and thought on this.
These 8 settings are not complicated. Most of them are just a checkbox, a dropdown, or a short text field. But they are easy to skip the first time through. The implementation gets marked as done and nobody goes back.
But some of these configurations also surface real business questions. How do you want to define a session? What should a missing campaign value actually mean? These are not just technical decisions, they are analytical ones. I really think it is worth having these conversations before you get six months into reports built on defaults nobody agreed to.
All settings described here are based on what I have tried to apply in our own environment and are available in the Data View Settings tab. Adobe’s documentation on Data Views covers each of these in more detail if you want to go deeper on any of them.
Join the discussion
Leave a comment